A Closer Look at the Correlation Between Google Trends and Initial Unemployment Insurance Claims
Since the onset of the pandemic, there has been growing interest in tracking labor market activity with “big data” sources like Google Trends.1 Just as an example, one can track how the number of Google searches with the term unemployment office has changed over the past week for the Chicago metro area or explore how unemployment became one of the top searched issues across the U.S. during the early months of the pandemic here.
In this post, we show that at the U.S. metro area level, the positive correlation between the Google Trends unemployment topic index2 and the rate of unemployment insurance (UI) take-up during the Covid-19 pandemic is primarily driven by variation within U.S. metro areas across time (the time series dimension) and less so by variation across U.S. metro areas within weeks (the cross-sectional dimension). Furthermore, it also appears likely that at least some of this correlation has been driven by UI policy changes and the news coverage surrounding them as opposed to search activity more directly related to filing a UI claim.
The Covid-19 pandemic’s impact on metro area UI claims
We use two primary data sources in our analysis: weekly county-level initial UI claims and daily Google Trends indexes for the unemployment topic (see note 2). The county-level initial UI claims data are for Pennsylvania, New York, Texas, and Washington, and we get them from their state governments (through the Haver Analytics database). To these data, we then add Google Trends unemployment topic indexes at the designated market area (DMA) level, which is the smallest level of geographic disaggregation available that is consistent with the county-level UI claims data. We normalize the daily Google Trends indexes for each metro area against the national index to obtain data that are comparable across jurisdictions.3 We then average the daily indexes using the UI claim reference weeks. Finally, we aggregate the county-level UI clams data up to the DMA level to obtain a consistent metro-area-by-week panel of data.4
Figure 1 shows maps of initial UI claims per 1,000 residents at two points in time during the Covid-19 pandemic: first, for the week ending March 28, 2020, which is approximately the peak week of initial UI claims, and second, for the week ending May 30, 2020, which is the most recent week that we have county-level claims data for. The maps highlight two things: 1) the significant degree of heterogeneity in unemployment due to the Covid-19 crisis across metro areas, with metro areas in Washington and New York reporting much higher numbers of claims per capita than those in Texas and Pennsylvania (panel A), and 2) how labor market conditions have changed over the past few months in metro areas, with most outside of Texas seeing some improvement (panel B compared with panel A). These are the patterns in UI take-up that we aim to explain with the Google Trends data.
Figure 1. Initial unemployment insurance (UI) claims per 1,000 residents for metro areas in New York, Pennsylvania, Texas, and Washington
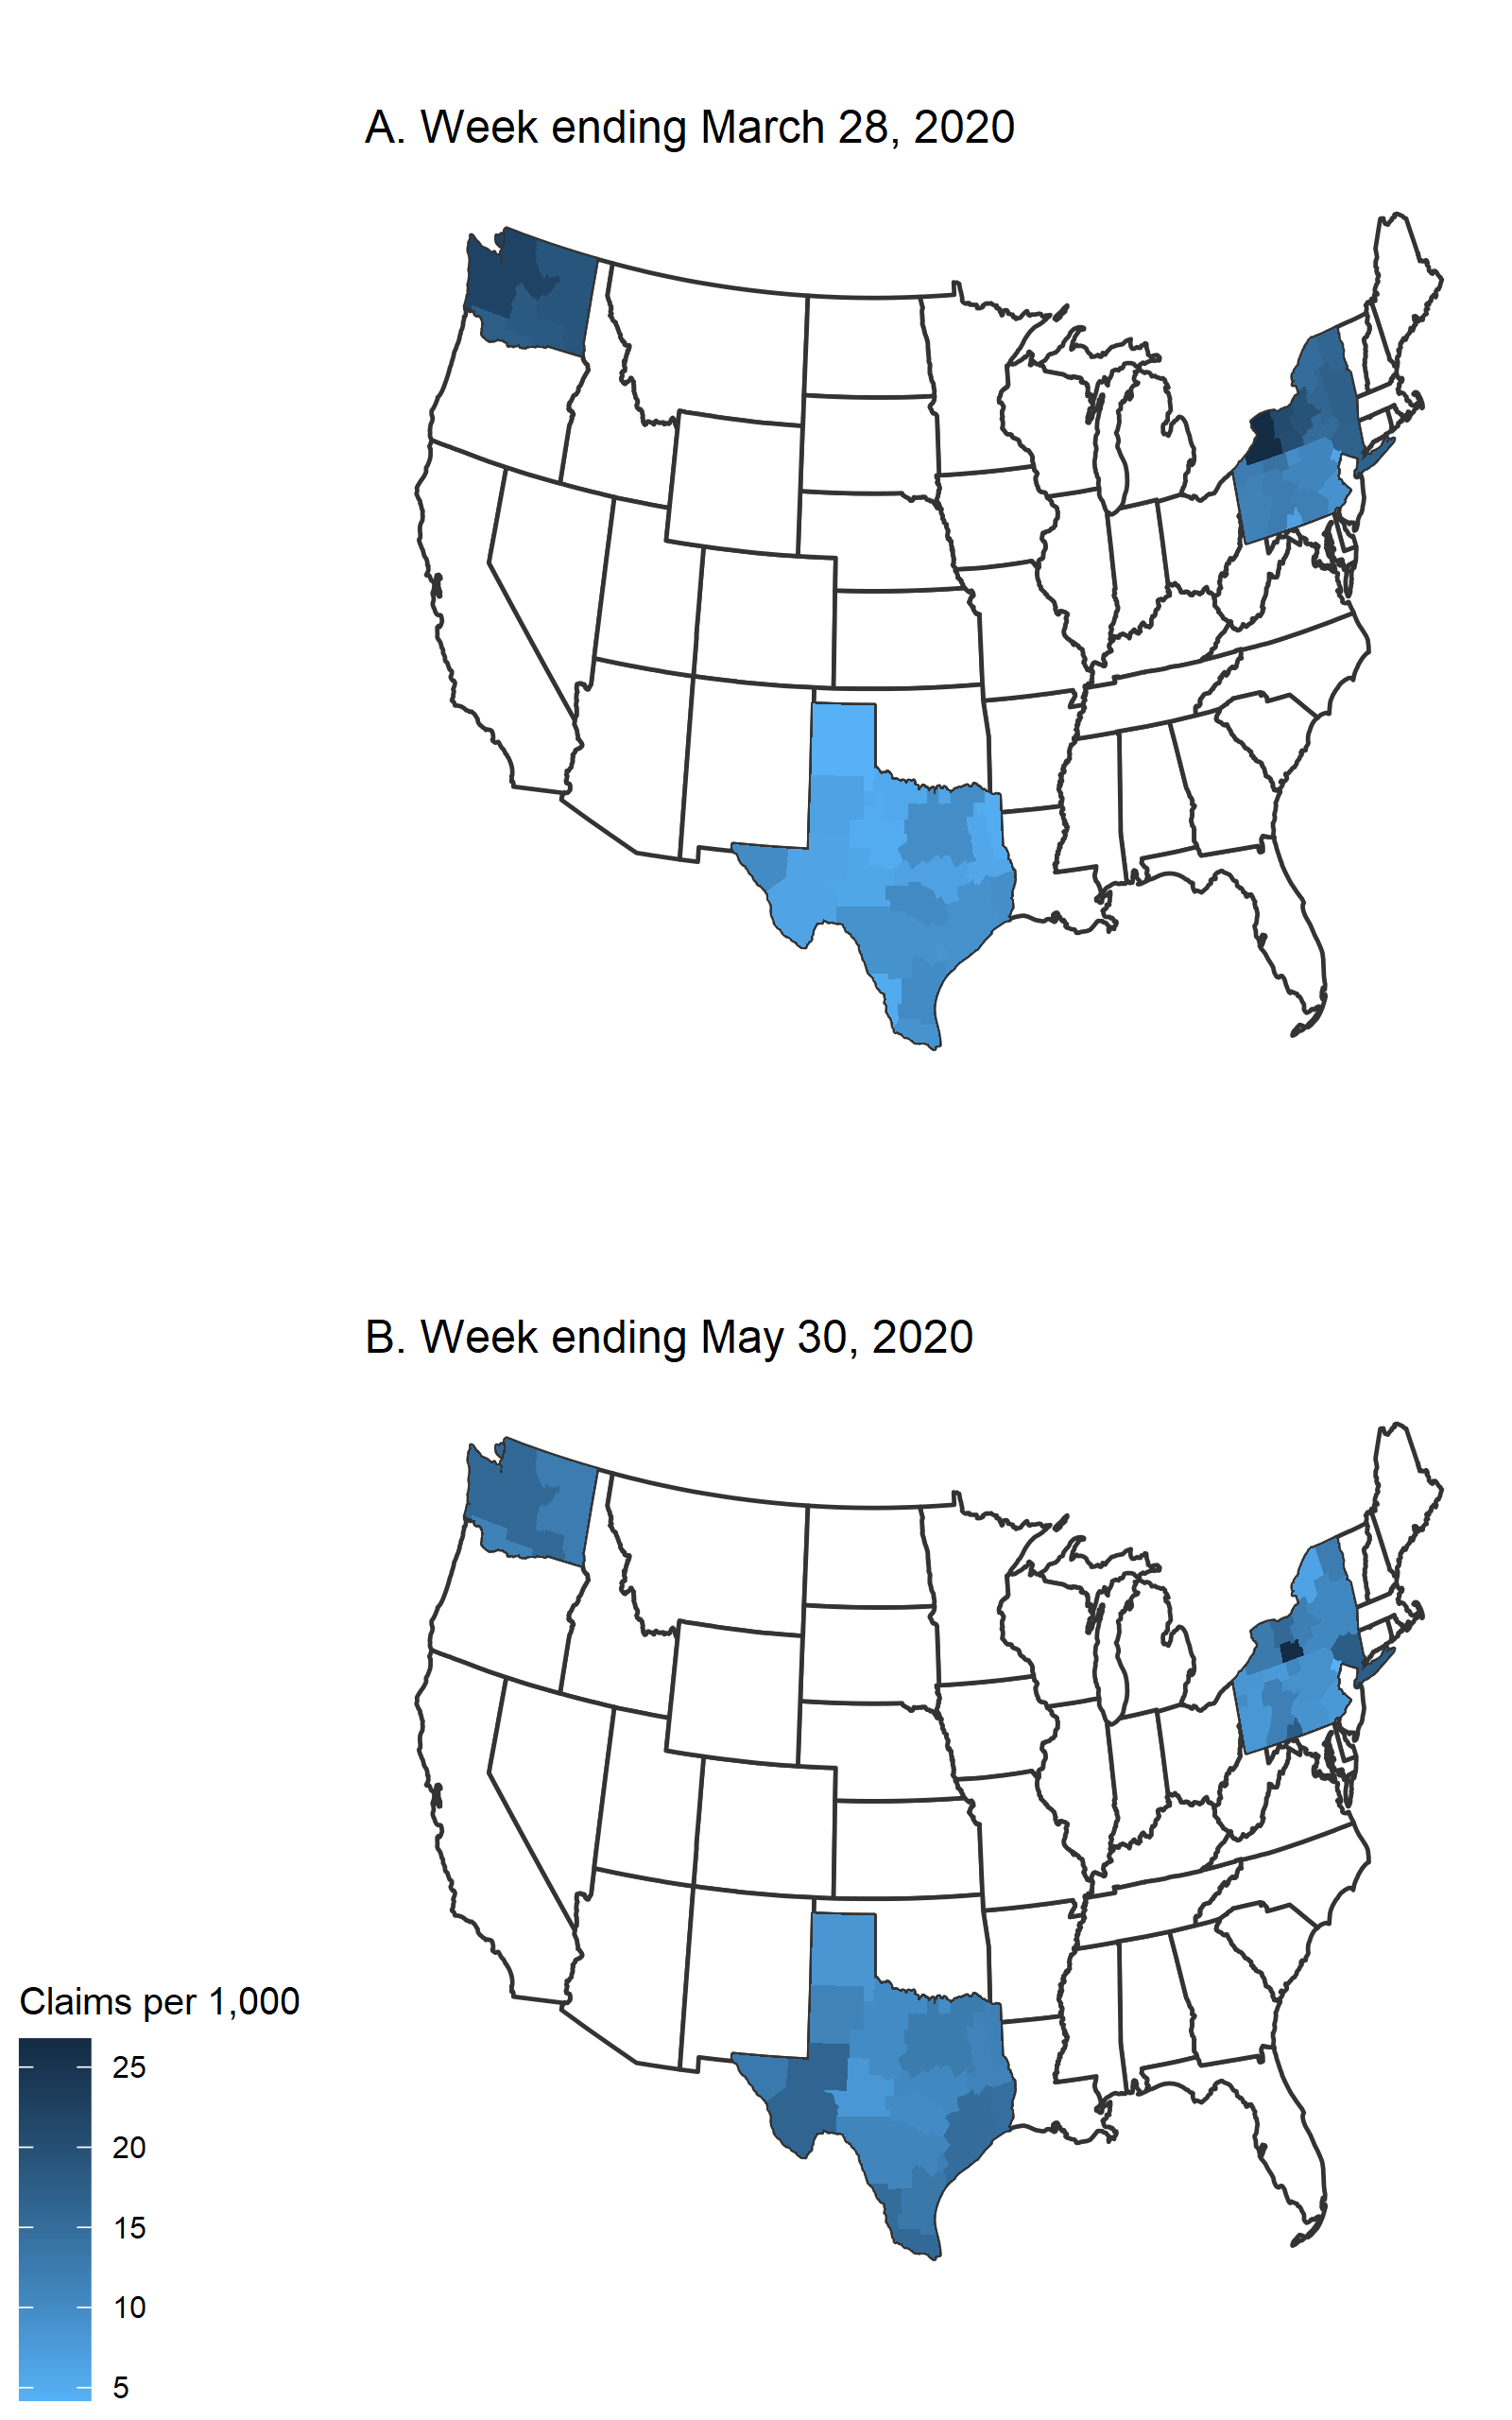
Sources: Authors’ calculations based on data from the New York Department of Labor, Pennsylvania Department of Labor & Industry, Texas Workforce Commission, Washington State Employment Security Department, and U.S. Census Bureau from Haver Analytics.
Google Trends and metro area initial UI claims
A fundamental hurdle with using Google Trends to explain UI take-up rates is distilling the “signal” from the “noise” of the data. The Google search data are what is often referred to as “unstructured” data. In our context, this means that they are not based on a sampling scheme that was designed expressly for the purpose of measuring UI take-up. Instead, these data are generated without a known sampling structure based on individual actions taken on Google that may or may not reflect the search activity related to how to file a UI claim. This makes identifying how they relate to UI take-up a nontrivial task.
The three linear regressions in table 1 summarize this challenge.5 Each regresses (log) initial UI claims (the dependent variable) for the 12 weeks from the week ending March 14 (just before the implementation of the first state public health orders in the U.S.) through the week ending May 30, 2020, on (log) search intensity as captured by the Google Trends unemployment topic indexes (the independent variable) while controlling for state-time fixed effects or metro area fixed effects or both. The sign and magnitude of the regression coefficient on search intensity vary considerably depending on the underlying assumptions of the three specifications in the table. In the rest of this post, we discuss these assumptions in more detail and what they imply for the relationship between initial UI claims and search intensity.
Table 1. The relationship between metro-area-level initial unemployment insurance (UI) claims and Google search intensity for unemployment-related terms
| Dependent variable | |||
|---|---|---|---|
| log(claims) | |||
| log(search) | –0.20 | 0.91*** | 0.37*** |
| (0.90) | (0.06) | (0.06) | |
| State-time fixed effects | X | X | |
| Metro area fixed effects | X | X | |
| Observations | 508 | 508 | 508 |
| Adjusted R2 | 0.31 | 0.90 | 0.99 |
**p < 0.05
***p < 0.01
Notes: This table presents the results from regression analyses examining the correlation between Google search intensity for unemployment-related terms and initial UI claims, controlling for state-time fixed effects, metro area fixed effects, or both and weighted by population. Standard errors, which are in parentheses, are clustered at the state level.
Sources: Authors’ calculations based on data from Google Trends and from the New York Department of Labor, Pennsylvania Department of Labor & Industry, Texas Workforce Commission, Washington State Employment Security Department, and U.S. Census Bureau from Haver Analytics.
With our data, we can explore the nature of the correlation between Google search intensity and initial UI claims along both the cross-sectional and time series dimensions. To isolate the variation in one of these two dimensions, we include a particular set of fixed effects to control for the variation present in the other. For example, the regression coefficient estimate in the first column of table 1 is based off of the cross-sectional variation in our panel of 42 metro areas. It controls for state-specific trends over the sample period that might result from differences in implementing lockdown measures (e.g., not all states had nonessential businesses close down at the same time) or in processing UI claims (e.g., the State of Washington’s new website for submitting claims faced many technical challenges initially, which delayed UI benefits for some).
Through this regression specification we are trying to answer this question: Are the metro areas in a particular state where we saw the most Google searches for unemployment-related terms in our panel also the metro areas where we saw the most initial UI claims? Examining only the cross-sectional variation, we find that there appears to be a very limited relationship between Google search intensity and initial UI claims in our data; i.e., the estimated effect of Google search intensity on claims is statistically indistinguishable from zero (the p-value associated with the standard error shown in the table is greater than standard levels of significance).
Why does this exercise reveal mostly noise in the data? We conjecture that it is because metro areas are inherently different for many other reasons (e.g., the makeup of the workforce differs from one metro area to another); and these other factors are likely to also affect how the constituents of a particular metro area engage with Google, as well as how they do in the labor market. To control for this possibility, we instead estimate the relationship using only time series information for each metro area by including metro area fixed effects in the regression instead of state-time fixed effects.
Through this alternative specification, we examine how deviations of search intensity and initial UI claims from the metro area’s average levels relate to each other. In other words, through this regression specification, we are trying to answer this question: Are the weeks when a metro area’s residents searched more than normal for unemployment-related terms also the weeks when we saw above-average initial UI claims in that metro area? The second column of table 1 reports the regression coefficient estimate from this specification, and it is quite different from the first specification’s estimate. There is an economically large (and statistically significant) positive relationship between Google Trends search interest in unemployment-related subjects and UI take-up. The size of this estimate is similar to that found in recent research by Aaronson et al.,6 which serves as the basis for their forecasts of state and national initial UI claims during the pandemic.
However, even in this case there remain some reasons to question the source of this correlation. The pandemic has also led to large changes in who is eligible to receive UI benefits and the magnitude of these benefits. These changes, along with the substantial news coverage about them and the historic take-up of UI during the pandemic, might have led to very different Google search behavior, at least in terms of how it relates to the take-up of UI over time across different U.S. states. Our final specification attempts to recover the extent to which this may be true by incorporating both sets of previously used fixed effects.
Through the final regression specification, we are trying to answer this question: After overall trends within the state are taken into account, are the weeks when search activity related to filing a UI claim was most pronounced the same weeks when the labor markets in metro areas were most affected by Covid-19? The third column of table 1 reports this specification’s regression coefficient estimate—which is smaller than the estimate reported in the second column, but still positive and economically large (and statistically significant). This result implies that there is scope for the possibility that the news surrounding unemployment and UI eligibility during the pandemic could have driven some of the correlation between Google search activity for unemployment-related subjects and initial UI claims.
In effect, this final specification is the most conservative one that we consider because it measures the relationship between Google search activity and UI take-up in a metro area independent of state-specific trends such as UI policy changes—or even national changes such as the introduction of Pandemic Unemployment Assistance (PUA)7—and related-news-driven search. In doing so, we find that a 1% increase in Google search intensity for unemployment-related terms translates to a 0.4% increase in initial UI claims. On this basis, the search activity captured in Google Trends can help explain the patterns in the metro-area-level initial UI claims data seen in figure 1.
For further analysis on the correlation between Google Trends and initial UI claims, please read this follow-up post.
Notes
1 See Hyunyoung Choi and Hal Varian, 2012, “Predicting the present with Google Trends,” Economic Record, Vol. 88, No. s1, June, pp. 2–9, Crossref; Choi and Varian show that Google Trends search interest for the unemployment topic can predict changes in labor market conditions, as measured by weekly initial UI claims.
2 A topic in Google Trends is a categorization or grouping of related search terms.
3 See Aaron Sojourner and Paul Goldsmith-Pinkham, 2020, “The coronavirus crisis led to a record-breaking spike in weekly unemployment insurance claims,” Working Economics Blog, Economic Policy Institute, March 24, available online; Sojourner and Goldsmith-Pinkham discuss in detail the need to normalize Google Trends data given its structure.
4 See Gaurav Sood, 2016, “Geographic information on designated media markets,” Harvard Dataverse, data set, version 9.0, Crossref; Sood provides a mapping between counties and the Nielsen DMAs that Google uses to define metro areas.
5 Regressions are statistical exercises that estimate the degree of correlation between two variables. In our case, the initial UI claims are the dependent variable (the main factor we are trying to predict) and the Google Trends unemployment topic indexes are the independent variable (the factor we think can be used to predict the dependent variable). Through regression analysis, we come up with a regression coefficient, which represents the mean change in the dependent variable for one unit of change in the independent variable while holding constant the other variables in the analysis that may affect the dependent variable.
6 Daniel Aaronson, Scott A. Brave, R. Butters, Daniel W. Sacks, and Boyoung Seo, 2020, “Using the eye of the storm to predict the wave of Covid-19 UI claims,” Covid Economics: Vetted and Real-Time Papers, No. 9, April 24, pp. 59–76, available online.
7 Details on this additional relief are available online.


