Michigan’s Economy is the Fastest Growing in the Midwest
According to the latest estimates from the U.S. Bureau of Economic Analysis, the Michigan economy grew by 1.9% in 2014 when compared with 2013 to an inflation-adjusted level of $417.3 billion. The sectors that realized the biggest gains on a percentage basis were private-service-related industries, including professional and business services, which saw the biggest real dollar increase of $2.3 billion, or 4.3%. However, manufacturing saw the second largest gain in real dollar value, increasing by $2.0 billion in 2014 from 2013. Other industry sectors that realized significant gains were information (3.6%), trade, transportation, and utilities (2.4%), and education and health services (2.0%).
It also looks as if Michigan’s economic expansion is poised to continue through 2015. Based on the most recent release of the Federal Reserve Bank of Chicago’s Midwest Economy Index (MEI), Michigan’s contribution to the economic growth of the Seventh Federal Reserve District decreased only slightly in June to 0.19; moreover, the June 2015 annual year-to-date average of 0.18 exceeds every annual average dating back to 1994. The MEI is a weighted average of 129 state and regional indicators for the five states of the Seventh District (Illinois, Indiana, Iowa, Michigan and Wisconsin). The index is designed to measure nonfarm business activity by tracking four broad sectors of economic activity: manufacturing, construction and mining, services, and consumer spending. A value of zero for the MEI indicates the Midwest economy is growing at its long-term trend rate of growth, while a positive number indicates above-average expansion and a negative number suggests below-average growth. Michigan’s contribution to the MEI of 0.19 for June would suggest that Michigan’s economy is performing better than its long-run average.
Chart 1. Michigan's Contribution to MEI

A quick look at the four components for the MEI show Michigan’s strong contribution for June was driven mostly by strength in manufacturing and positive contributions from the service sector and consumer spending. Although construction did not add to Michigan’s contribution, a value of zero still implies long-run average growth in the sector. Another indication of strength in manufacturing is the Institute for Supply Management (ISM)–Southeast Michigan Purchasing Managers Index, which was reported to be 66.1 for June (helping to keep the 12-month moving average above 50 for the 64th consecutive month). For this index, a value above 50 indicates that those surveyed are anticipating continued growth in manufacturing activity in the coming months. On the residential investment front, although the 12-month moving averages for housing starts and permits for Michigan remain well below their peak levels that were reached in 2005, both of them continued their slow upward trend in June, rising to 1,439 and 1,343, respectively. Strength in the service sector was supported by continued growth is service-related jobs, which have averaged annual growth of over 1.4% for the past five years. And finally, personal consumption is being supported by recent improvements in real per capita income, which was reported to be up 3.7% in 2015:Q1 on a year-over-year basis.
Chart 2. Michigan GSP & Employment - Annual Percent Change
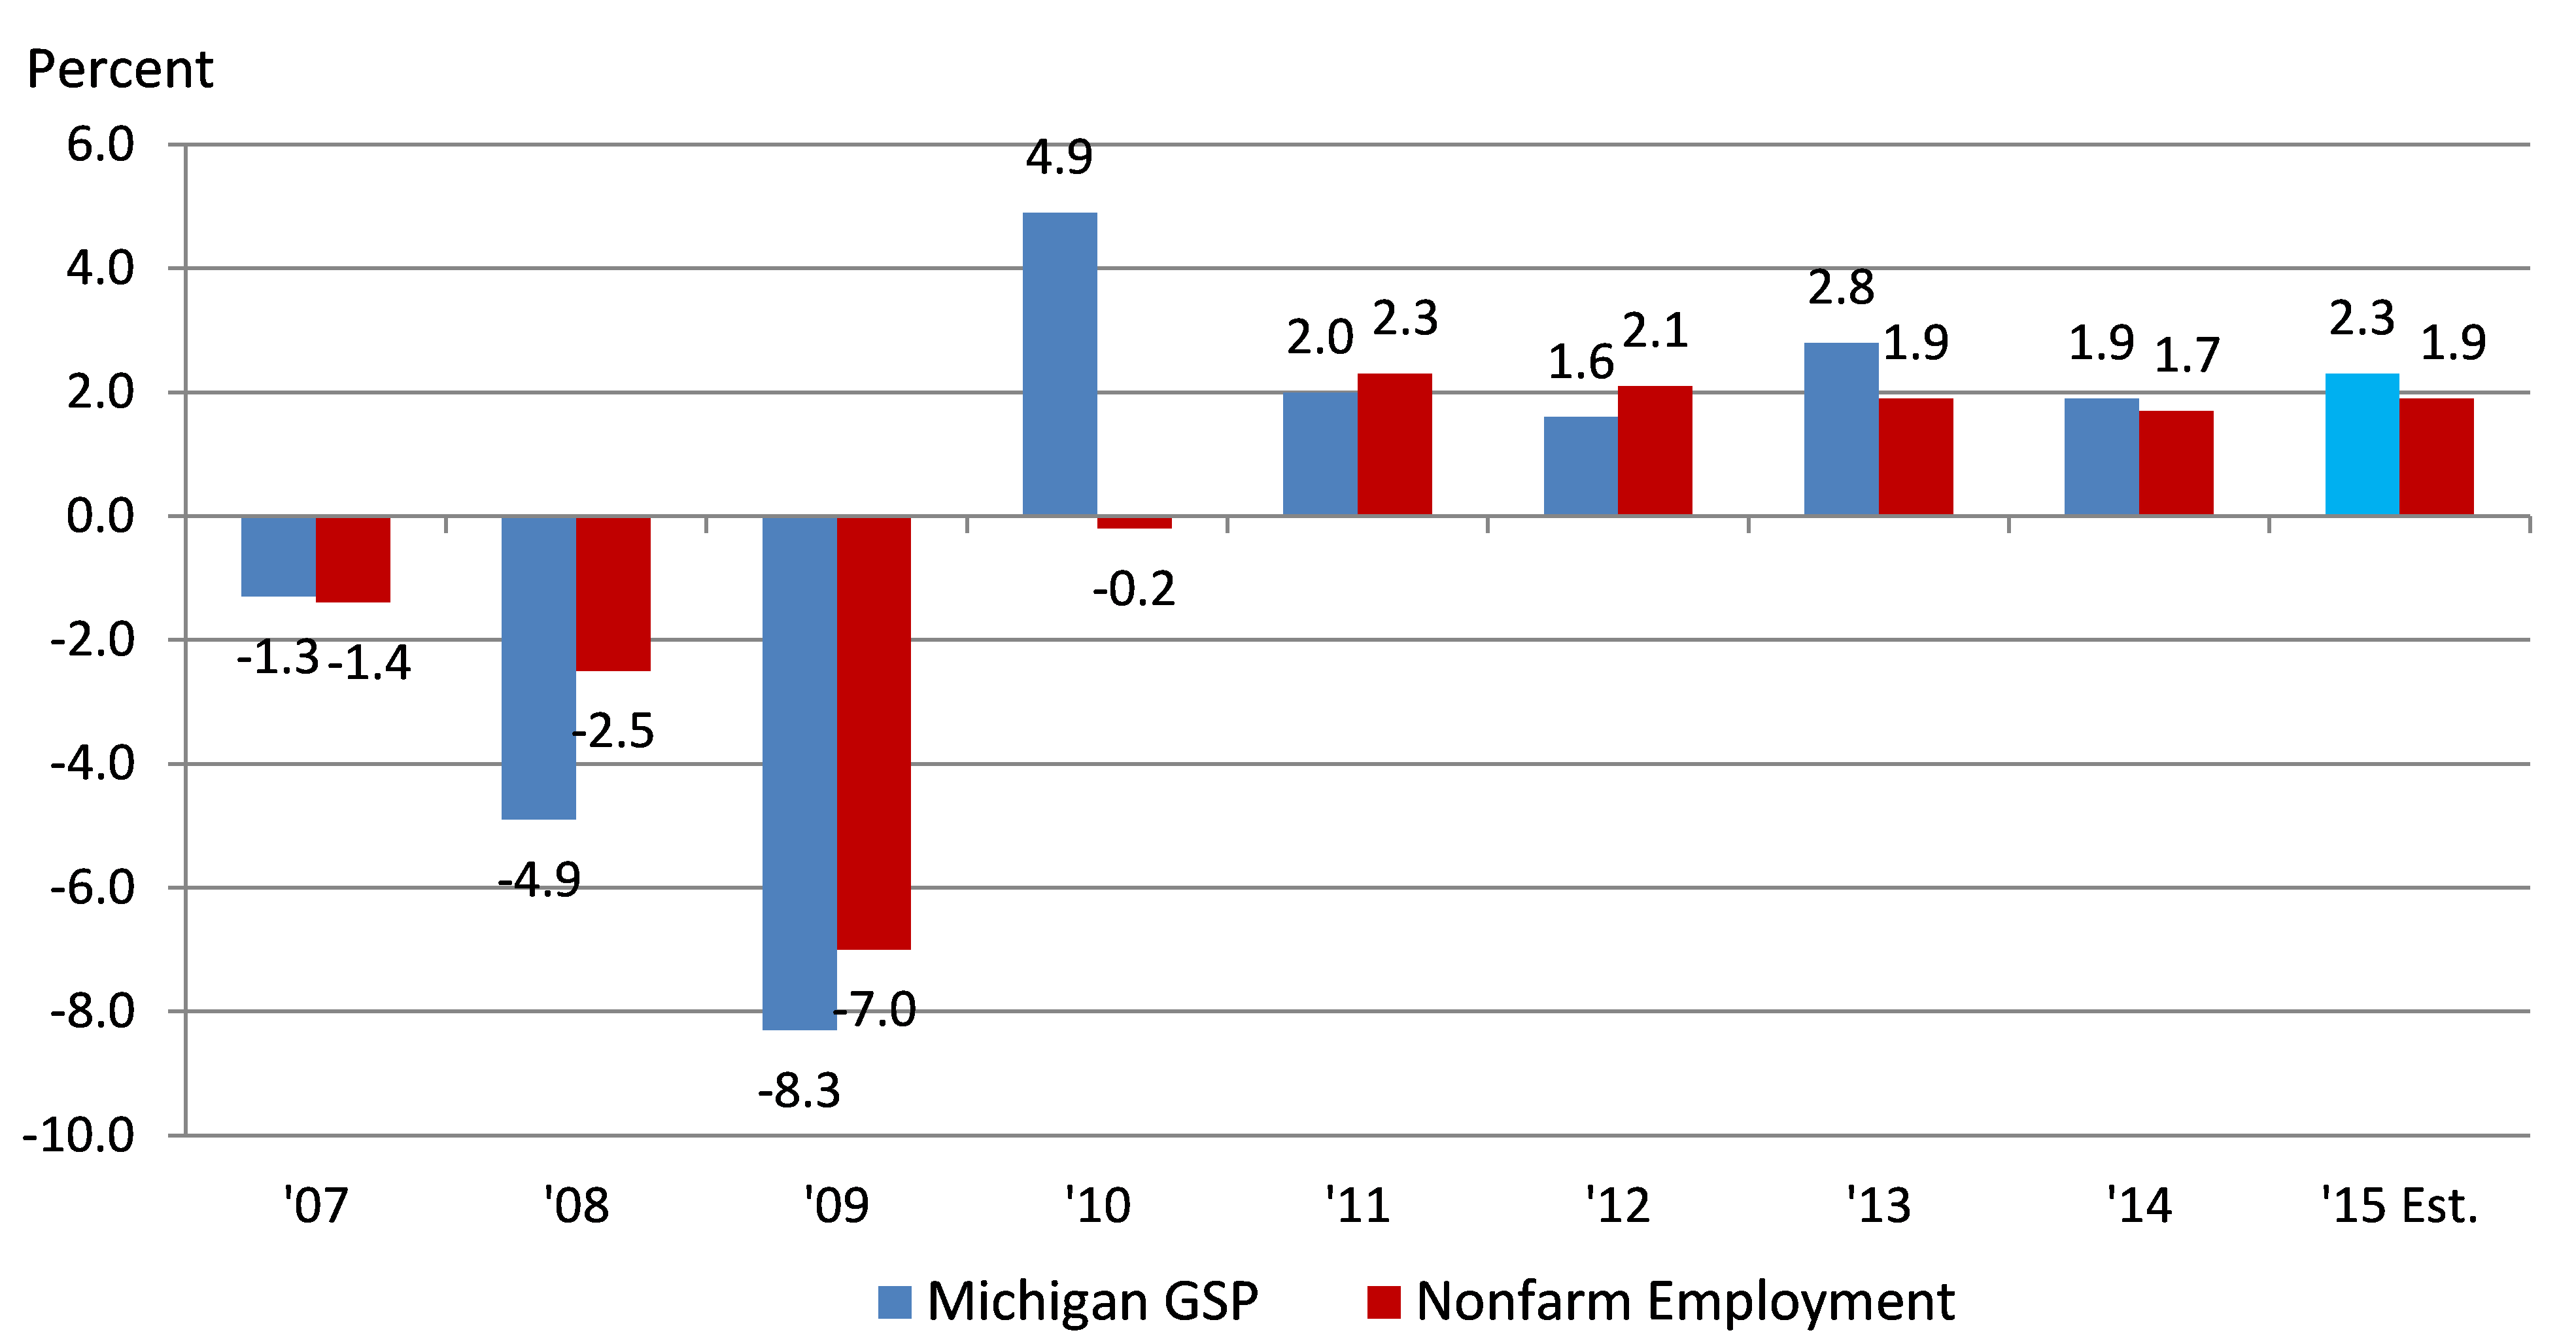
Based on the first six months of 2015 data used to generate the MEI, Michigan’s economy looks to be currently growing by an estimated 2.3% rate on an annualized basis. This estimate is supported by the fact that total nonfarm employment is up 1.9% year to date in 2015 compared with 2014; and as chart 2 indicates, there is a strong relationship between economic activity and changes in employment. The relationship between employment and economic activity can be explained in this manner. A firm can increase output in one of two ways. One way is to increase labor input—either by having its existing staff work more hours or by adding more employees. A second method would be to seek improvements in productivity—through investment in either physical or human capital. In essence, output growth or decline is a function of changes in labor inputs and productivity. More labor or higher productivity will result in increased output. The overall economy works in a similar manner, though tracking economic output is somewhat more complicated than this simple analysis for a firm would imply. This is because the outputs of different sectors of the economy provide different contributions. Nevertheless, the basic premise is the same for an individual firm and the economy as a whole.
The data also suggest that Michigan’s economy still remains highly dependent on the manufacturing sector, which accounted for 21.2% of Michigan’s gross state product (GSP) in 2014. Because almost half of Michigan’s manufacturing output is related to the auto industry, the projected (continued) growth in light vehicles sales and production for the foreseeable future suggests that Michigan’s economy should sustain its positive momentum, at least through the rest of this year.
While Michigan never relied solely on the auto industry for employment and economic growth, this industry’s importance to the state should not be overlooked. While Michigan has seen a significant shift away from its reliance on manufacturing jobs to more service-related employment, the auto industry’s contribution to the state’s economy remains significant. As chart 3 shows, in 2000, manufacturing accounted for 19.2% of all nonfarm employment in Michigan, or the equivalent of 896,900 jobs. Since 2000, manufacturing’s share of total nonfarm employment has shrunk: Today it stands at 13.8%, or 575,700 jobs. Granted, while manufacturing’s contribution to Michigan’s GSP has fallen somewhat over the past decade and a half (decreasing from 24.5% in 2000 to 20.1% in 2014), it is still a large part of the overall Michigan economy.
It is also important to note that within Michigan the employment share of the private service sector has gone up from 61.5% in 2000 to 68.4% in 2015. However, during the past 15 years, private service sector employment in Michigan has remained relatively flat, moving up somewhat from 2,879,400 in 2000 to 2,902,850 jobs today. The increase in service sector employment share without a significant addition to payroll employment can be explained by the fact that total nonfarm employment in Michigan is down over 400,000 jobs from its peak in April 2000. Despite the modest gains in payroll employment, the private service sector’s contribution to Michigan’s GSP increased from 59.6% in 2000 to 64.5% in 2014.
Chart 3. Michigan Nonfarm Employment by Industry (as Percent of Total Nonfarm)
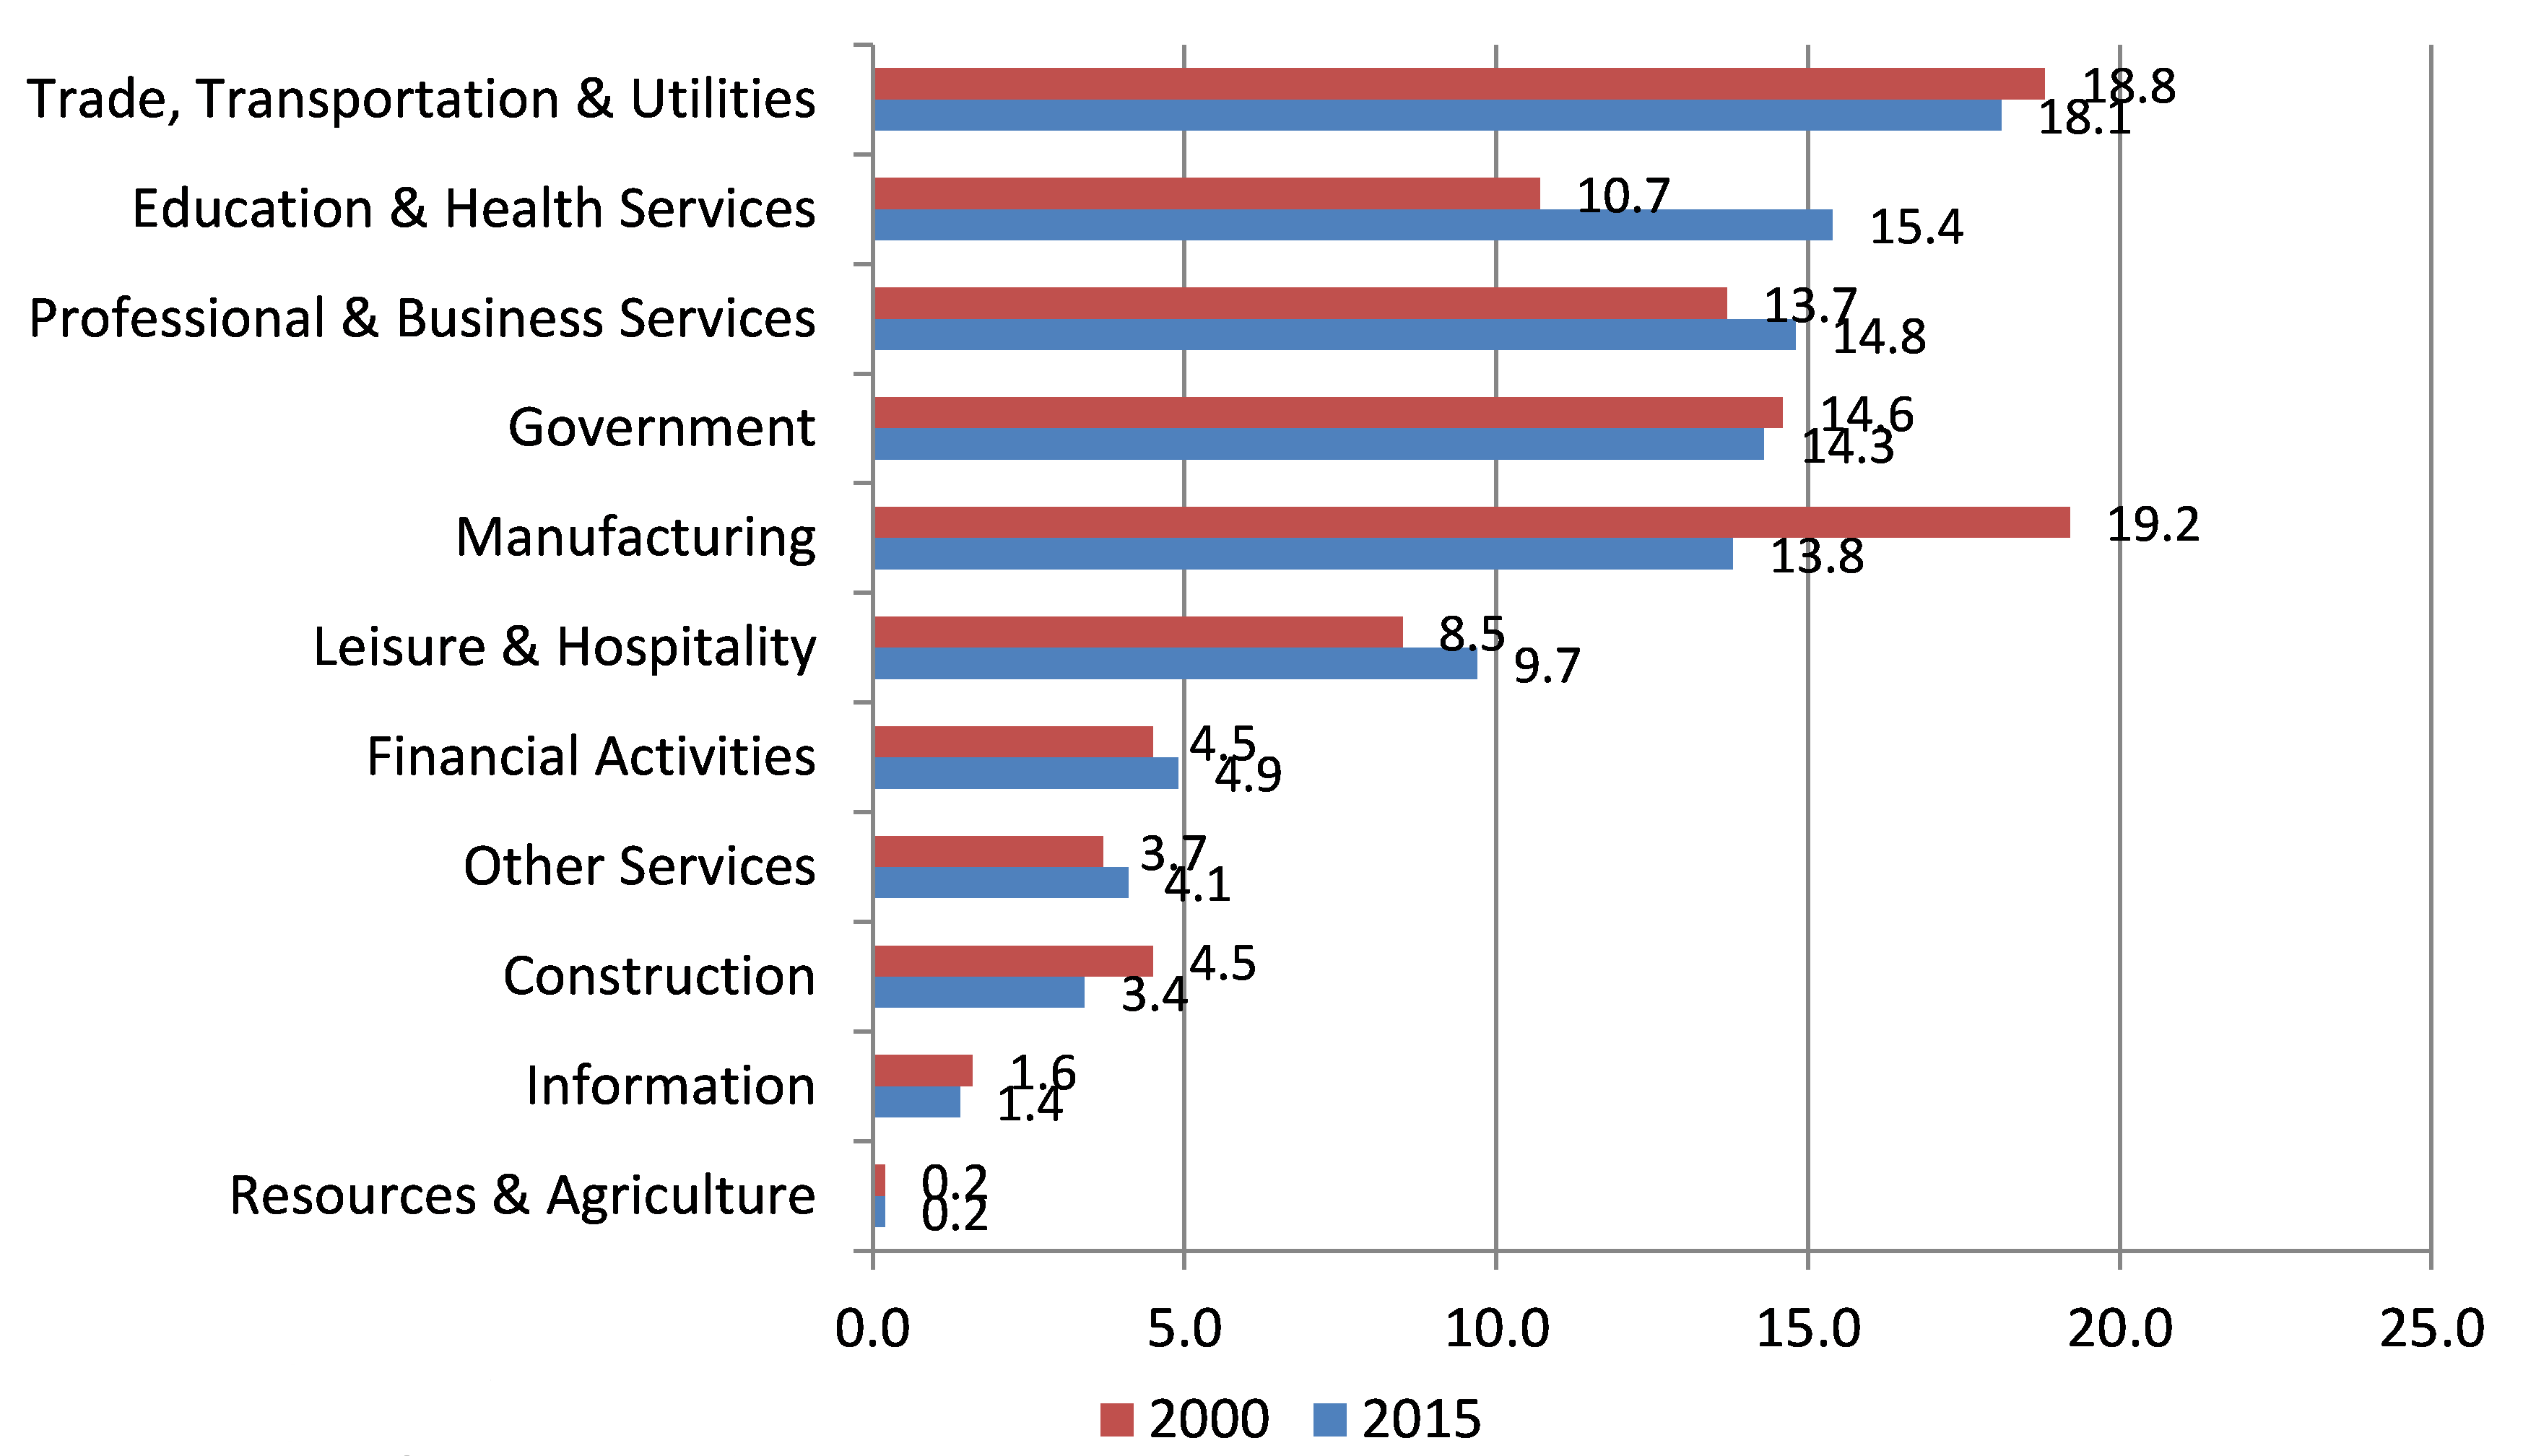
While some of the overall service sector growth has been in more high-skilled, high-paying industries, such as professional and business services, there has also been significant growth in low-skilled, low-paying industries, such as education and health services and leisure and hospitality. It could be argued that the increase in the share of low-paying service-related jobs in Michigan has had a slightly negative impact on average annual wage growth in the state. A sector-weighted calculation of annual average nonfarm payroll using wages by sector for 2013 would suggest that if the state still had the same employment by industry distribution today as it did in 2000 the all-sector annual average wage would be approximately $51,100 today versus $50,100 in 2000, or roughly 2% higher.
For a more detailed look into the numbers behind Michigan’s economic performance, follow this link to the Michigan Blog’s Michigan Economic Update – 2015:Q2.


