How Tight is Michigan’s Labor Market?
Michigan’s labor market continues to recover from the Great Recession that ran from December 2007 through June 2009 and its own recession that started four years prior to that. Michigan’s unemployment rate peaked at 14.9% in June 2009, coinciding with the end of the Great Recession. Since that time, Michigan’s unemployment rate has dropped steadily, reaching 4.5% in August 2016. The last time Michigan’s unemployment rate was this low was in January 2001, just before the much shorter and milder 2001 recession.1
While Michigan’s current labor market expansion isn’t the longest in its history,2 the fact that the state’s unemployment rate is now lower than that of the nation makes one wonder how much longer it can last. The superior performance of Michigan’s Southeast and Western Michigan Purchasing Managers indexes relative to the U.S. measures and recent indications that auto sales may have plateaued also imply that Michigan’s labor market expansion may be near a turning point. This blog examines some of Michigan’s labor market indicators to assess whether Michigan’s labor market is at or near “full employment.”
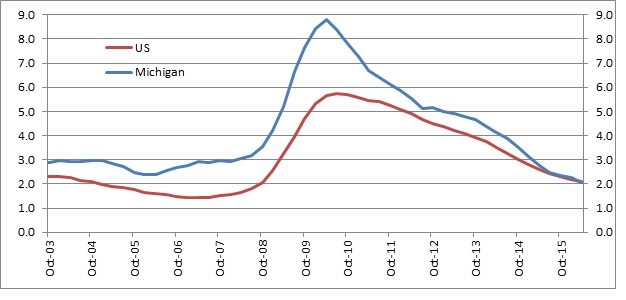
Chart 1. Unemployment Rates, Annual Averages: U.S., Michigan Analysis
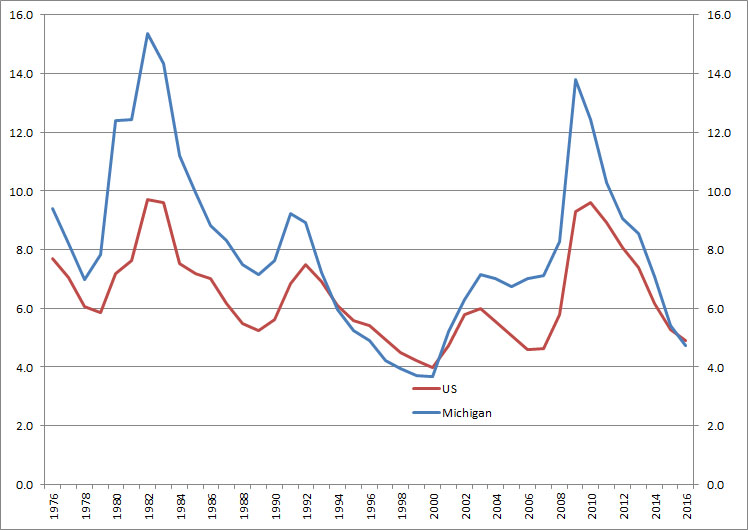
The chart above shows the annual averages of the U.S. and Michigan unemployment rates, respectively. Since 1976, Michigan’s unemployment rate has generally been higher than that of the U.S., especially during the Great Recession and the severe 1981–82 recession. The two instances in which Michigan’s unemployment rate fell below that of the U.S. came during the mid to late 1990s and in recent months. The fluctuation in Michigan’s unemployment rate helps to show the cyclical nature of the state’s economy, driven by the manufacturing sector, specifically the automotive industry. The lows in Michigan’s unemployment rate came during boom times for the automotive industry and the highs came during rough times. Light vehicle sales volumes hit all-time highs last year and are just below those levels year-to-date in 2016. The majority of auto analysts feel that light vehicle sales will continue to slightly fall off of their 2015 highs in the next couple of years. With the automotive industry having peaked, does that mean Michigan’s labor market has peaked as well?
Historically, another sign of a tightening labor market are increasing wages and salaries. The chart below plots the unemployment rate versus workers’ total wage and salary income in the state.
Chart: Annual Wage & Salary Growth vs. Annual Average Unemployment Rate: Michigan
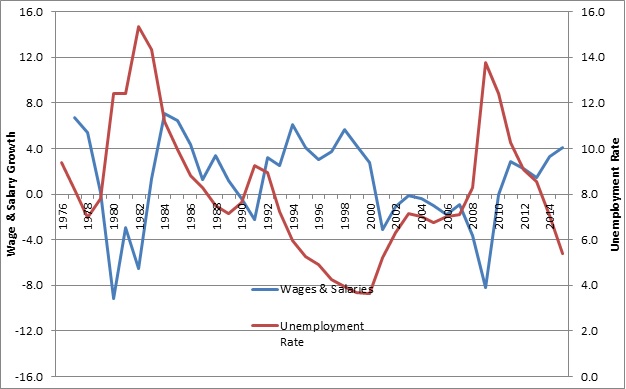
Over the past 40 years, changes in wage and salary income have led changes in the unemployment rate. Michigan’s unemployment rate reached its previous low in 2000, a few years after the rate of growth in wage and salary income peaked. Wage and salary income growth in Michigan bottomed out in 2008, the year before Michigan’s unemployment rate peaked. As Michigan’s unemployment rate decreased after the Great Recession, wage and salary income consistently increased, accelerating in the last two years following some slowing in 2012–13. The pace of wage and salary growth edged higher in 2015 versus 2014, signaling further tightening in Michigan’s labor market. Despite the increase in wages and salaries, however, data from the Bureau of Economic Analysis show that per capita income in Michigan remains about 12% below the national average. Since 1980, per capita income in Michigan has typically been lower than in the U.S. as a whole.
When looking at wage pressures by sector, the story becomes more muddled. The chart below examines the year-over-year percentage change in wage pressures in select employment sectors in Michigan.
Chart 2. Average Hourly Earnings of Michigan Production Employees by Employment Sector, Year/Year Percentage Change, Not Seasonally Adjusted
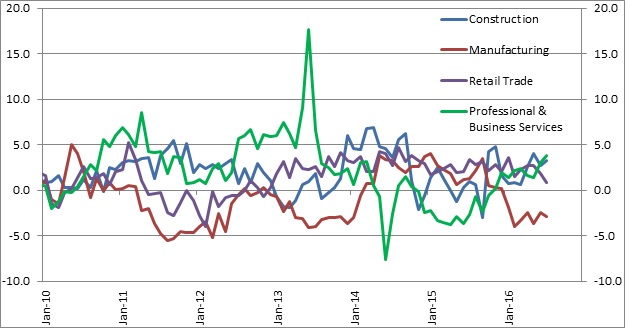
Michigan’s manufacturing sector, especially the automotive sector, led the state into the recovery it currently enjoys. However, after increasing in 2010, wages started to fall during 2011 and into 2012 as the new labor contract with the United Auto Workers (UAW) that created a lower, 2nd tier of wage ranges took effect.3 After rebounding in 2013–15, wages are lower thus far in 2016 than in 2015, possibly because of the 2015 UAW contract that created a lower starting point for entry-level full-time workers.4 Plateauing production volumes as light vehicle sales level off may also be a reason for lower wages in 2016.
Some sectors do support the full employment argument with their accelerations in recent months. Since the latter half of 2015, wages have moved higher in the construction and professional and business sectors, respectively. Labor shortages in building construction and within the engineering and information technology fields of the professional and business services sector have helped to create conditions for higher, more competitive wages. Wage increases have persisted in the retail trade sector since 2013. Competitive pressures from McDonalds and Walmart, as well as legislatively mandated increases in Michigan’s minimum wage, have contributed to higher wages in the retail sector.5
When a labor market tightens, it also means workers are increasingly hard to find. One unique characteristic of the current labor market recovery is the elevated level of those working part-time for economic reasons or involuntary part-time workers. The chart below shows what percentage of the labor force is comprised of involuntary part-time workers.
Chart 3. Part-Time Employment as a Percentage of Labor Force, 4-quarter moving average: U.S., Michigan
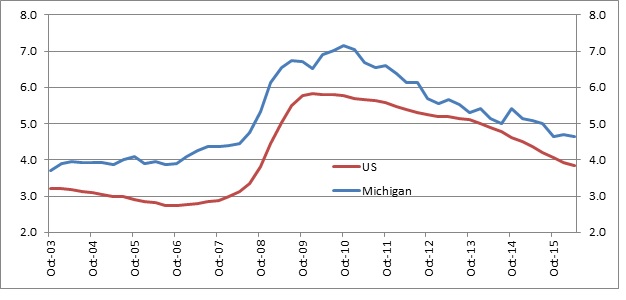
As labor markets expand, the percentage of the labor force that is working part-time falls. In Michigan and the U.S., the percentage of the labor force that is working part-time continues to be higher than during the previous labor market expansion. Interestingly, the difference between the part-time segments of the labor force in Michigan and the U.S. has shrunk after widening in the months leading up to and the year after the conclusion of the Great Recession. Another interesting point is that the gap between Michigan’s current percentage of the labor force that is working part-time and the percentage working part-time in the 2000s is narrower relative to the U.S. This could mean one of two things. One possibility is part-time workers in Michigan are finding increasing success in gaining full-time employment. An alternative possibility is part-time employment was elevated during the 2000s and Michigan’s one-state recession. Therefore, part-time employment as a percentage of the labor force would have been expected to fall since the mid-2000s.
In a tightening labor market, those who found themselves unemployed for a long period of time should find their way back into the workforce. The chart below looks at the percentage of the labor force that was unemployed longer than 15 weeks.
Chart 4. Unemployed Civilians for longer than 15 weeks as a Percentage of Labor Force, 4-quarter moving average: U.S., Michigan
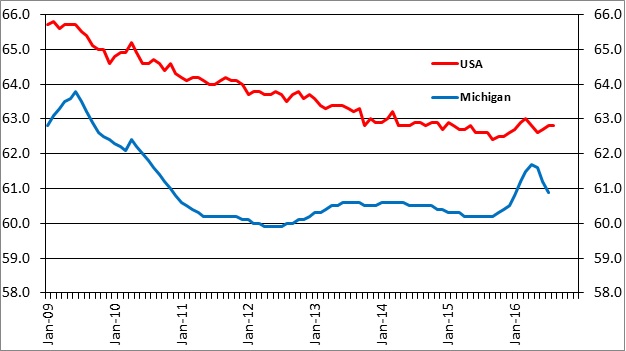
Mirroring the previous chart, Michigan had a greater percentage of its labor force unemployed for more than 15 weeks than the U.S., most likely a result of Michigan’s recession in the previous decade. After peaking in the 2nd quarter of 2010, the percentage of Michigan’s labor force unemployed for more than 15 weeks fell and now equals that of the U.S. Are more previously long-term unemployed workers finding work or are they dropping out of the labor force altogether? Looking at the next chart, which shows the labor force participation rates of the U.S. and Michigan, respectively, we see that Michigan has seen a higher net increase off its lows than the U.S.
Chart 5. Labor Force Participation Rates: U.S., Michigan
Finally, what about discouraged workers? If a labor market is tightening, the number of discouraged workers should be decreasing. The chart below shows discouraged workers as a percentage of the labor force in the U.S. and Michigan, respectively.
Chart 6. Discouraged Workers as a Percentage of Labor Force, 4-quarter moving average: U.S., Michigan
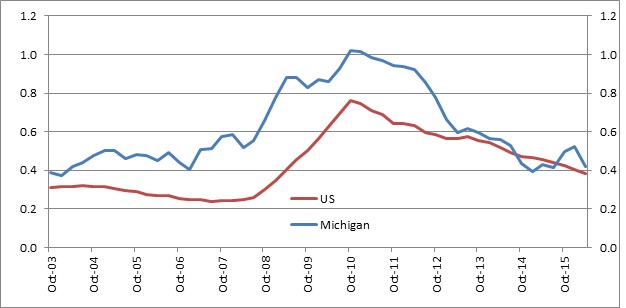
Again, the same dynamics are in play from 2003 through the end of the Great Recession, with Michigan’s labor market relatively worse off because of its one-state recession. As shown in the previous chart, the gap between Michigan and the U.S. converged and is now all but eliminated. The current percentage of Michigan’s labor force that consists of discouraged workers equals that seen during the mid-2000s, whereas the U.S. hasn’t reached mid-2000s levels yet.
Conclusion
A strong argument can be made that Michigan’s labor market is at full employment. The unemployment rate is currently below that of the U.S. and nearing historical lows. Also, wage and salary growth is at its highest in almost 20 years, labor force participation is off its post-recession lows, and data focused on the marginally attached to the labor force in different ways indicate those numbers are near or at trend. Some anecdotal reports support the argument as well. Multiple firms have instituted significant wage and salary increases in order to keep their most talented employees, while others are giving prospective employees a second look after rejecting their original job inquiry. Finally, with the auto industry operating at peak production levels and historically high sales levels and the state still significantly dependent on the auto industry, Michigan’s robust labor demand growth may be coming to an end.
Footnotes
1 We are addressing labor market tightness here, not growth rates, not restoration of past levels of labor force size. Out-sized outmigration of working age population in response to the state’s prolonged downturn in the last decade is being held in the background.
2 Based on BLS data going back to 1976.
3 More information is available online.
4 More information is available online.
5 More informatoin is available online.


