Are Businesses Returning to Detroit?
Introduction
Detroit’s population fell by almost 50% from its peak of 1.85 million in 19501 to around 950,000 in 2000. Since 20002, Detroit’s population has declined at a faster rate. The U.S. Census Bureau reports that Detroit’s population stood at 680,250 as of 20143. As Detroit’s population migrated elsewhere, so did many of its businesses. How many businesses have left the Motor City since around the turn of the twenty-first century? And are new businesses replacing them in the aftermath of the Great Recession (which ended in mid-2009)?
In this blog entry, I will address these questions by using the County Business Patterns (CBP) data series from the U.S. Census Bureau. The CBP data series provide the number of business establishments4 by county and zip code. The business establishments reported in the data are sorted by employment size classes. In addition, CBP data sets provide employment and payroll data. CBP data are collected on an annual basis, but with a two-year lag. Here I will analyze business patterns by geography and industry among Detroit zip codes (and elsewhere) between 1998 and 2013.
Analysis
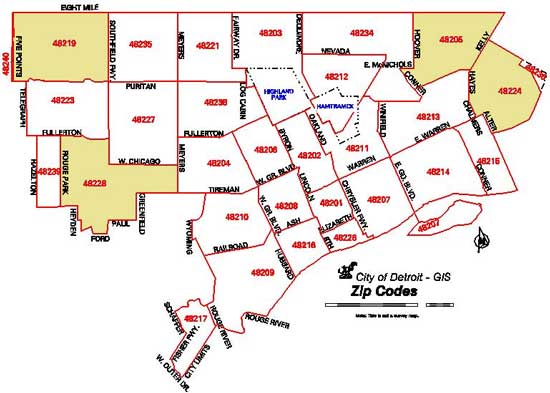
Figure 1 shows a map of Detroit by zip code. The zip codes shown below were used to analyze the change in the number of business establishments in Detroit over the period 1998–20135.
Figure 1. Map of Detroit zip codes

Table 1. Percent change in number of Detroit business establishments, by zip code, 1998–2013
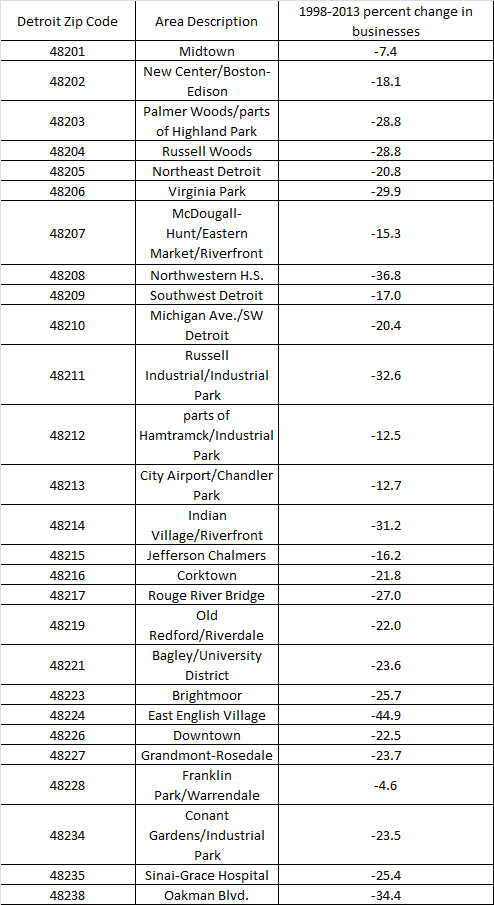
For each Detroit zip code area listed in table 1, I include the prominent neighborhoods and/or landmarks found within it.
Overall, the number of Detroit business establishments decreased 22.3% over the period 1998–2013, according to my calculations using CBP data. As of 2013, the city of Detroit was home to 8,817 business establishments. Approximately one-eighth of these establishments can be found in Downtown Detroit—which saw a similar share of its businesses depart as the city as a whole did over the sample period. Zip code areas that fared relatively better than the city in terms of business retention between 1998 and 2013 contain the Midtown/New Center area along Woodward Avenue, Eastern Market, some areas along East Jefferson Avenue parallel to the Detroit River, and southwest Detroit (including Corktown). These centers of commercial activity are now leading Detroit’s turnaround. Zip code areas that saw a larger percentage of their businesses leave relative to what the city as a whole experienced contain some of Detroit’s struggling neighborhoods—which include East English Village adjacent to Harper Woods and the Grosse Pointes, as well as areas near and around the old Packard plant in Detroit’s eastern industrial corridor6.
Anyone familiar with Detroit’s narrative will likely be able to give several reasons why its business activity has declined over the past few decades. Besides the outward migration of the residential population, the downsizing and suburbanization of the local manufacturing industry, the deterioration of the city’s talent base as a result of the struggles of the Detroit Public Schools (DPS), government corruption, and the worsening condition of the city’s infrastructure are just some of the contributors to Detroit’s downward trend in business activity.
Given the narrative about Detroit, it is natural to wonder how its recent business losses compare with those of its surrounding areas. Table 2 shows the change in the number of establishments by selected areas in 1998 versus 2013. The national numbers are also given to provide another basis of comparison.
Table 2. Number of business establishments, 1998 versus 2013, and percent change in the number of business establishments, 1998–2013, by selected areas
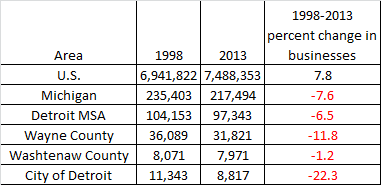
Source: Author’s calculations based on data from the U.S. Census Bureau, County Business Patterns.
Table 2 shows that despite the 2001 and 2007–09 recessions, the number of business establishments in the nation as a whole increased over the period 1998–2013. However, the number of business establishments declined throughout most of Michigan during this time. Wayne County (including Detroit) and the Detroit metropolitan statistical area (MSA)—encompassing Macomb, Oakland, and Wayne counties—experienced less severe business losses than the city of Detroit. Nearby Washtenaw County, whose county seat is Ann Arbor7, still saw a slight drop in the number of business establishments over the sample period, but fared much better relative to the city of Detroit.
When examining industry business patterns in the city of Detroit, it is not surprising to find that in percentage terms, manufacturing experienced the greatest loss of businesses over the period 1998–2013. Table 3 shows the change in the number of business establishments by industry during the sample period.
Table 3. Number of business establishments, 1998 versus 2013, and percent change in the number of business establishments, 1998–2013, in the city of Detroit, by industry
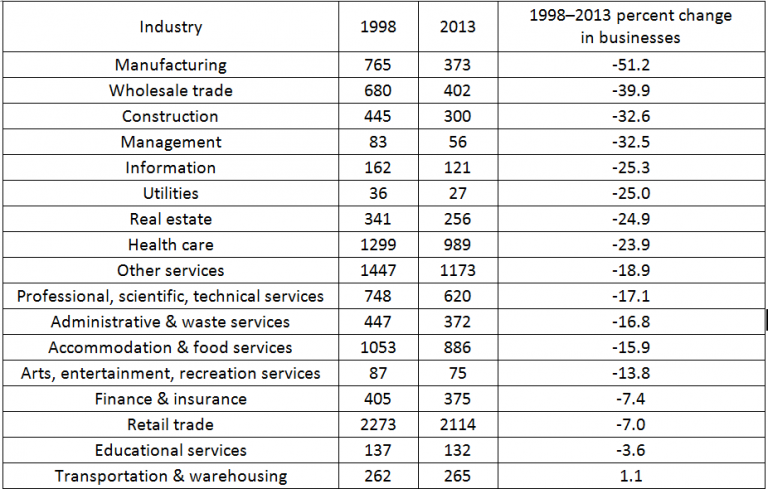
One may be somewhat surprised by which subsectors of manufacturing experienced the greatest losses of business establishments (not shown). When analyzing the business pattern data by NAICS8 code, I found that transportation equipment manufacturing—which includes motor vehicle and parts manufacturing—experienced a sizable drop in the number of establishments (41.5%); but this decline wasn’t the largest one. The manufacturing subsector that experienced the largest decline in establishments in percentage terms was printing and related support activities (–75.3%), followed by machinery manufacturing (–69.9%)9. When just looking at the raw numbers of business losses among the manufacturing subsectors, I found that fabricated metal product manufacturing experienced the greatest losses: this subsector lost 86 establishments from 1998 through 2013 (almost a 50% contraction). Of the 26 zip codes I analyzed, 17 of them saw greater-than-50-percent declines in the number of manufacturing establishments.
Conclusion
During the 1998–2013 period, the city of Detroit lost business establishments every year. Detroit lost a higher percentage of establishments than its surrounding areas, the state of Michigan, and the United States. The most significant sectorial losses of businesses were from the goods-based side of the economy—most notably, from manufacturing. While the most severe manufacturing losses weren’t from direct transportation equipment manufacturing, they were in complementary industries, such as fabricated metal manufacturing, machinery manufacturing, and printing activities. Geographically speaking, establishments close to Detroit’s border with the Grosse Pointes and those around the former Packard automobile assembly plant shut down in greater proportions than those in other parts of the city.
Because the most recent data available are 2013 data, I am unable to provide any definitive insight into any possible changes in the trend of establishments leaving Detroit since the city exited bankruptcy in late 2014. By many anecdotal accounts, numerous new establishments have settled in the Downtown, Midtown, Corktown, and other select neighborhoods where the most significant public and private investment has occurred of late. As we receive more and newer data, it will be interesting to see whether new business establishments are sprouting up elsewhere in Detroit. Will business (and public) investment in Detroit remain concentrated in its high-activity areas or begin to noticeably branch out to the city’s relatively less active neighborhoods?
Footnotes
1 More information is available online.
2 More information is available online.
3 More information is available online.
4 More information is availble online for what is considered a business establishment versus a business firm. In this blog entry, businesses refer to business establishments.
5 Please note, however, that the 48203 zip code area also includes the city of Highland Park and the 48212 zip code area also includes the city of Hamtramck. The 48239 zip code area lies predominantly outside the city of Detroit, so it wasn’t included in the analysis.
6 More information is available online.
7 More information is available online.
8 NAICS stands for North American Industry Classification System. For more details, see this site and this site.
9 I only considered manufacturing subsectors with more than 50 establishments in 1998.


