2007 Economic Growth in the Seventh District
For nations, gross domestic product (GDP) is the most widely used yardstick to measure economic activity and growth. Conceptually, GDP measures the value of output produced by the market economy within a year or other period. In addition, GDP is defined as output produced within a designated geographic area such as a nation’s boundaries.
There is one more major wrinkle in this measure; GDP is typically reported as “real” GDP, meaning that the dollar values of goods and services are adjusted to reflect price changes. Such adjustments are made so that, for example, output growth reflects real gains in both the quantity and quality of what a nation produces, and not merely dollars transacted.
GDP matters to people, workers, and households because what is produced gives rise to what is earned in wages, salaries, and earnings on capital and savings. Accordingly, in many economics textbooks, the GDP concept is presented alongside its equivalent yardstick, gross national income.
In the U.S., the Bureau of Economic Analysis (BEA) produces data on GDP so that the pace of overall economic activity and its many components can be tracked on a timely basis. More recently, BEA has begun to provide timely GDP estimates for states and regions. On June 5, for example, the BEA released preliminary estimates for states and regions covering the calendar year 2007.
BEA data on GDP growth by individual states for 2007 shows a general economic slowdown that mirrors the national slowdown from 3.1 percent in 2006 to 2.0 percent in 2007. In all, 36 states experienced slowing GDP growth in 2007 versus 2006, with weakness centered in finance and in construction—especially housing.
The BEA’s map, reproduced below, shows several features of GDP growth in the Seventh District states—Illinois, Indiana, Iowa, Michigan, and Wisconsin.
1. Percent change in real GDP by state, 2006-2007
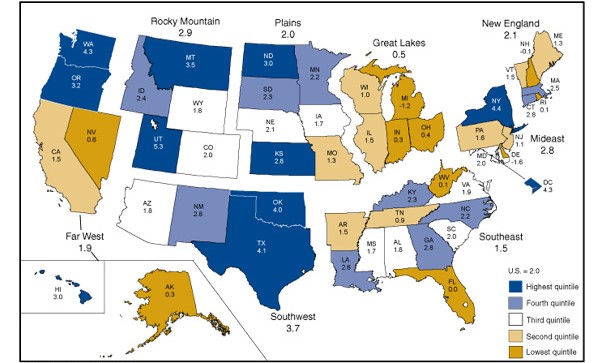
GDP growth in all five states of the Seventh District fell short of the national level in 2007. Michigan recorded a decline of 1.2 percent, marking the state’s second year in a row of economic output decline and its third such year over the past four.
In contrast to Michigan’s ongoing slow growth, many previously high-growth states in other regions experienced sharp declines in growth for 2007 versus their 2006 pace of growth. In particular, Arizona’s growth pace slowed from a 6.7 percent pace in 2006 to 1.8 percent in 2007; California went from 3.8 percent to 1.5 percent, Florida from 3.6 percent to flat, and Nevada from 5.4 percent to 0.6 percent.
The overall pace of growth in the Seventh District states slowed much less dramatically—from a pace of 0.9 percent in 2006 to 0.6 percent in 2007. This can be attributed to two major developments. First, the size of the highly impacted residential construction industry is much larger in high-growth states such as Arizona, Nevada, and Florida. While Midwestern states have experienced similarly sharp declines in housing activity, the impact has been proportionately larger outside of the region.
Another factor is that the U.S. manufacturing sector did not decline to the same extent in 2007 as it has in previous economic slowdowns. The falloff in new home sales and construction has exerted a drag on certain manufacturing industries, such as building materials and home appliances. However, other industries, such as machinery and computing equipment, continue to be buoyed by rapid growth in exports abroad, while others, such as mining and farm machinery, are being lifted by the global surge in commodity demand. For the manufacturing-intensive Midwest, then, the pace of overall economic growth has not slowed as much as it has in most previous episodes.
Another notable trend can be seen from the differing pace of growth within the Seventh District (see map above). Starting from the eastern states of the Seventh District, GDP growth in Indiana and Michigan significantly underperformed the western states of Illinois, Wisconsin, and Iowa. By way of explanation, the sagging domestically domiciled U.S. automotive industry exerts a heavier influence on Indiana and Michigan (and Ohio, too).


