Exports and the 2008 Economic Slowdown
Back in the 1930s, policy makers perhaps contributed to the economic downturn by sharply lifting tariffs on imports into the U.S.—the infamous Smoot-Hawley legislation passed on June 17, 1930 that raised import tariffs on over 20,000 goods. In response to these policy actions, our trading partners raised tariffs (and nontariff barriers) on U.S. exports. If the U.S. intention was to keep jobs at home, the effect was probably to aggravate unemployment here and abroad.
In recent years, trading activity with other nations has been a definite engine of growth for the U.S. Exports are contributing much to an otherwise faltering pace of economic growth. Though exports comprise only 12.4 percent of U.S. output, export growth accounted for one-half of the nation’s (2.0) percent GDP growth in 2007; exports accounted for one-third of GDP growth over 2006 and 2007. Indeed, in every year since 2002, the growth of exports has added at least one-half percentage point to national output growth.
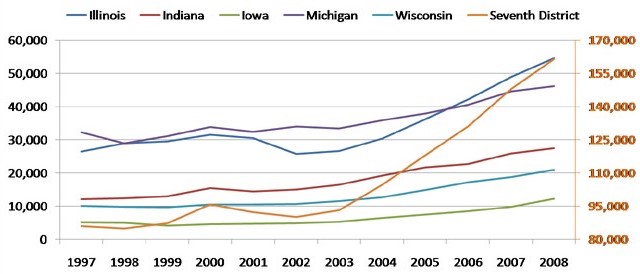
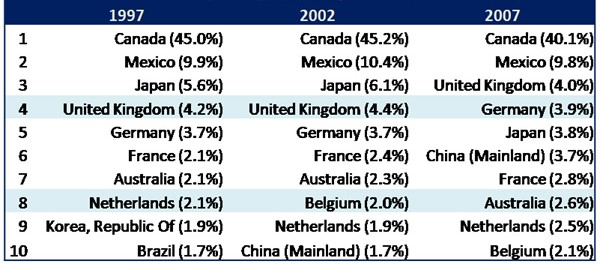
Per the graph below, export growth has similarly lifted incomes and output in the Seventh District. Overall, nominal export value climbed by $54.7 billion, or 58.7 percent, from 2003 through 2007, with every District state joining in the expansion. Per the table below, our NAFTA partners, Canada and Mexico continue to be our largest export destinations, with China growing rapidly over the 1997-2007 period.
Figure 1. Export volume by value ($ millions)

Source: Wisertrade
Table 1. Seventh District top 10 export trading partners

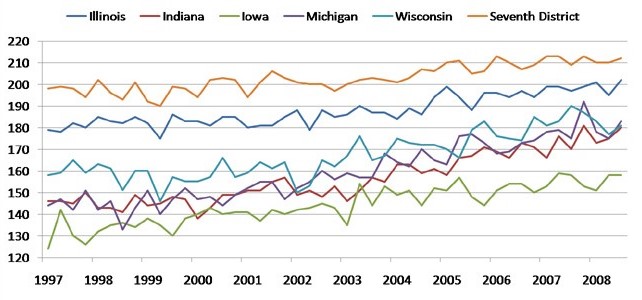
The strong role of our NAFTA partners as an export destination reminds us that growth in trade often comes about from the hard policy work involved in negotiating trade agreements with other countries. The graph below illustrates the growing number of countries that now receive exports from producers in Seventh District states. Each District state has added a fair number of trading partners since 1997.
Figure 2. Number of export trading partners

Aside from avoiding the (past) mistake of squelching international trade, the U.S. also has the opportunity to expand its export opportunities in the years ahead. Awaiting enabling legislation from the U.S. Congress, bilateral or two-nation agreements have been negotiated with Panama, Columbia and South Korea. To learn more about these agreements and those that have preceded it, one source of information is TradeAgreements.gov (this web site is a joint effort between the Departments of Agriculture, Commerce, State, Treasury and the Office of the United States Trade Representative).
Note: Vanessa Haleco-Meyer contributed to this weblog.


