City-Suburban Population and the Housing Bust
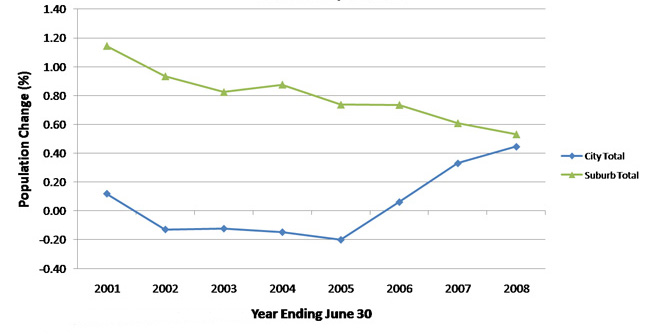
Demographer William H. Frey calls to our attention a striking turnaround in population growth in the central cities of metropolitan areas. Since the 2005-06 peak of the housing construction boom in the United States, the growth rates of central cities have begun to gain ground on surrounding suburban areas. Beginning with 2005 and ending with population estimates reported by the Census Bureau for mid-year 2008, Frey illustrates a convergent city-suburb trend for U.S. metropolitan areas having a population over one million. These trends hold for all four major U.S. regions—North, Midwest, South, and West. (The 12-state Midwest population performance is shown below).
Figure 1. Principal city and suburb growth in Midwest metro area over 1 million population

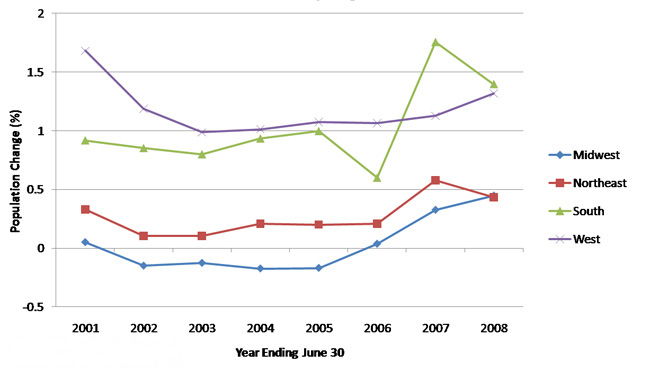
Similarly, Frey reports that these gains “are not confined to the very largest American cities. Among the 75 cities with populations exceeding 200,000, 41 grew faster in 2007-08 than in the preceding year, and 54 grew faster than in 2004-05.” We show the population trends for such cities by region below. Once, again, we can see that the turnaround has taken place, on average, in all Census regions of the U.S.
Figure 2. Annual growth of cities with populations over 200k by region

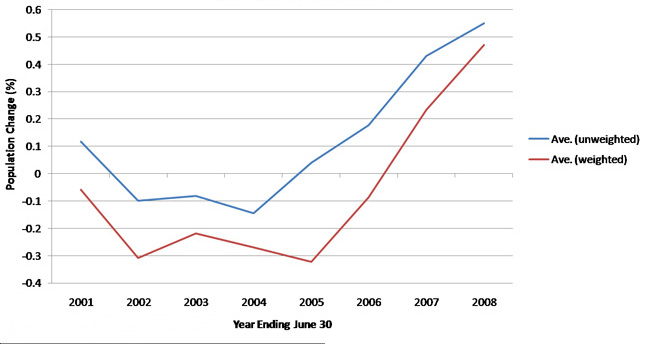
Within the Seventh District states of Illinois, Indiana, Iowa, Michigan and Wisconsin, growth has also tended to rebound in cities over 200,000 in population (below). For the year ending in the middle of 2008, six of seven cities exhibited positive population growth. However, the City of Detroit is an outstanding exception with an accelerated decline in the mid-year ending 2008.
On average, Seventh District cities shifted from zero or negative growth in 2005 to an annual growth rate of 0.5 percent for 2008. The largest swings in performance were registered by Des Moines, with a swing from minus 1.3 percent in 2004 to plus 1.2 percent in 2008, and Chicago, with a swing from minus 0.7 in 2005 to plus 0.7 for 2008.
Figure 3. Annual growth rates of 7th District cities with populations over 200k (and Des Moines)

Table 1. Annual growth rate of 7th District cities with populations over 200k

* All years ending June 30
At this point in time, the reasons for this shift toward central cities remain open to speculation. But given the timing, there are strong reasons to believe that the housing bust lies behind much, if not most, of the reversal. A general rise in demand for housing, such as that which occurred earlier in this decade, exerted a magnified impact on the fringe of urban areas. Given the lower price of land on the fringe and the ease with which larger single family homes can be constructed there (rather than tear-downs closer in), both population and housing generally shifted towards the periphery. Construction jobs related to fringe development likely bolstered the trend, as some households followed job opportunities to the suburbs. And now we may be seeing a reversal of such trends as home demand and employment have fallen off.
William Frey also attributes the urban population resurgence to the nature of the urban economies, citing “broad economic diversity at a time when smaller cities … are vulnerable to economic shocks” and the “resiliency of large urban centers that are economically and demographically diverse.” There may be some wisdom in thinking that this is so. In pursuing economic development, central cities have been trying to attract and grow “Eds and Meds,” (education and health care). As measured by George Erickcek and Tim Bartik of the Upjohn Institute, health care and hospitals, along with colleges and universities have been a bulwark of the economic base of many cities. These sectors of the U.S. economy have tended to grow and expand consistently, and cities have benefited. From the 2000 Census, Bartik and Erickcek report that earnings derived from the education sector are, on average, 36 percent more concentrated in the principal cities of the nation’s 283 metropolitan areas. Health care earnings are 12 percent more concentrated.
Nonetheless, with the release of the next mid-year Census estimates (for 2009), it will be interesting to see if central cities are able to sustain their momentum of population growth in relation to suburban areas. Beginning with 2009, the influences of the sharp U.S. recession and related job declines may become important.1 Favoring central city economies, the education and health care sectors are steady performers even in recessions. So too, many central cities no longer host manufacturing production, which tends to be hit particularly hard during recessions. However, in many cities other elements of the economic base are both concentrated and highly sensitive to economic downturns. Such sectors include professional and business services, law, tourism/business travel, and especially the financial sector, which has been buffeted by the recent financial crisis.
Table 2. Index of job concentration, 2004

* 2003 data
Little evidence is available so far concerning the differing impact of the two national recessions, 2001 and the current one, on city versus suburb. However, in a recent report by the Metropolitan Policy Program at Brookings, Elizabeth Kneebone and Emily Garr report on year-over-year unemployment rates for city versus suburbs in the nation’s 100 largest metropolitan areas. They find that “in contrast to the last recession,” when city unemployment rates rose more sharply versus their suburbs, “unemployment has increased at nearly equal rates in cities and suburbs.”2 The table below excerpts the year-over-year rise in unemployment rates for cities and their suburbs for several Seventh District cities and their suburbs and for the four major regions of the United States.
Table 3. Recent unemployment changes, 7th District cities and suburbs, and by region

Note: Thank you to Emily Engel and Matt Olson for assistance.
Footnotes
1 To some degree, people tend to locate their residences in proximity to their jobs, so that job locations would tend to drive population growth as well.
2 The difference in the gap between the two recessions is not large. Year over year changes in unemployment rates in cities rose by 1.9 percent in primary cities versus 1.4 percent in suburbs from May 2001 to May 2002. For May 2008 to May 2009, year-over-year rates rose by 3.9 and 3.7 percentage points, respectively, for cities and suburbs. However, city/suburb unemployment rate differences in level are wider currently than in the 2001-02 period.


