Can the Great Lakes Region Break Free of its Long-term Slide?
How can we best understand and adapt to the Region’s long term changes? There are three trends that are fundamental to assessing the Region’s economic behavior and prospects. One is the region’s sharp sensitivity to the national business cycle. The region continues to specialize in manufacturing, especially durable goods sectors such as automotive and machinery. For this reason, the region exhibits above-average swings in employment and business activity as the U.S. economy falls into a recession or recovers afterward. The second trend behavior concerns the Region’s long term re-structuring out of manufacturing. Here, it is not so much that the Region’s manufacturing specialization has abated. Rather, since manufacturing productivity gains give rise to fewer workers, and because consumer demand growth for manufactured goods does not compensate for rising labor-saving productivity, the region’s economic base does not keep pace with the nation. Finally, from decade to decade, the Great Lakes Region has experienced pronounced deviations from its overall growth trend. Quite independently of the long term manufacturing trend, and independently from the two recessions of the 2000s, the boom years of the 1990s have given way to longer term realities. In retrospect, the 1990s experience are an aberrantly prosperous time from which to extrapolate the Region’s future. In order to accurately gauge the Great Lakes Region’s challenges and prospects, all three perspectives must be integrated. As a whole, the Regions outlook remains challenged, but there are also opportunities and possibilities for revived prosperity.
Great Lakes and the Business Cycle
Both the nation and the Region’s employment base have been shifting out of manufacturing and toward service sectors. However, this does not mean that the Region’s economic base no longer rests firmly in manufacturing. In relation to the United States, the Region’s employment specialization in manufacturing has perhaps sharpened in comparison. As shown in Table 1, construction of an index of specialization shows some surprising evidence to this effect. Because farm employment in the region consolidated prior to regions such as the Southeast, farm concentration has sharpened here in relation to the nation. The same can be said of manufacturing—both the durables and non-durables sectors. By 2009, both lie well north of average, with durables concentration at 79 percent above the nation. Nondurables has meanwhile climbed to 34 percent above the nation. Here, food processing employment is the Region’s bulwark while, elsewhere, nondurable staples such as textiles have tended to shed jobs.
Table 1. Job index by industry, 1970, 1990, and 2009 (Great Lakes region, index; 1.00 = U.S.)

How can we best understand and adapt to the Region’s long term changes?1 There are three trends that are fundamental to assessing the Region’s economic behavior and prospects. One is the region’s sharp sensitivity to the national business cycle. The region continues to specialize in manufacturing, especially durable goods sectors such as automotive and machinery. For this reason, the region exhibits above-average swings in employment and business activity as the U.S. economy falls into a recession or recovers afterward. The second trend behavior concerns the Region’s long term re-structuring out of manufacturing. Here, it is not so much that the Region’s manufacturing specialization has abated. Rather, since manufacturing productivity gains give rise to fewer workers, and because consumer demand growth for manufactured goods does not compensate for rising labor-saving productivity, the region’s economic base does not keep pace with the nation. Finally, from decade to decade, the Great Lakes Region has experienced pronounced deviations from its overall growth trend. Quite independently of the long term manufacturing trend, and independently from the two recessions of the 2000s, the boom years of the 1990s have given way to longer term realities. In retrospect, the 1990s experience are an aberrantly prosperous time from which to extrapolate the Region’s future. In order to accurately gauge the Great Lakes Region’s challenges and prospects, all three perspectives must be integrated. As a whole, the Regions outlook remains challenged, but there are also opportunities and possibilities for revived prosperity.
Great Lakes and the Business Cycle
Both the nation and the Region’s employment base have been shifting out of manufacturing and toward service sectors. However, this does not mean that the Region’s economic base no longer rests firmly in manufacturing. In relation to the United States, the Region’s employment specialization in manufacturing has perhaps sharpened in comparison. As shown in Table 1, construction of an index of specialization shows some surprising evidence to this effect. Because farm employment in the region consolidated prior to regions such as the Southeast, farm concentration has sharpened here in relation to the nation. The same can be said of manufacturing—both the durables and non-durables sectors. By 2009, both lie well north of average, with durables concentration at 79 percent above the nation. Nondurables has meanwhile climbed to 34 percent above the nation. Here, food processing employment is the Region’s bulwark while, elsewhere, nondurable staples such as textiles have tended to shed jobs.
Table 1. Job index by industry, 1970, 1990, and 2009 (Great Lakes region, index; 1.00 = U.S.)

The Region’s continued concentration in manufacturing means that national swings in activity are felt unduly by the region’s households. During downturns, as households experience trepidations about their jobs, they try to preserve their household assets in liquid form, and to pay down debt. In particular, households reduce spending on durable goods, bringing down manufacturing sales and production. For example, this past recession, automotive sales fell in half from peak to trough. Domestic production fell even more sharply which, by way of jobs and wages, rippled through automotive households in Michigan, Indiana, Ohio and elsewhere. So, too, this time around, international trade in goods and services plummeted amidst the global financial crisis, bringing down the Region’s exports of machinery and other capital goods.
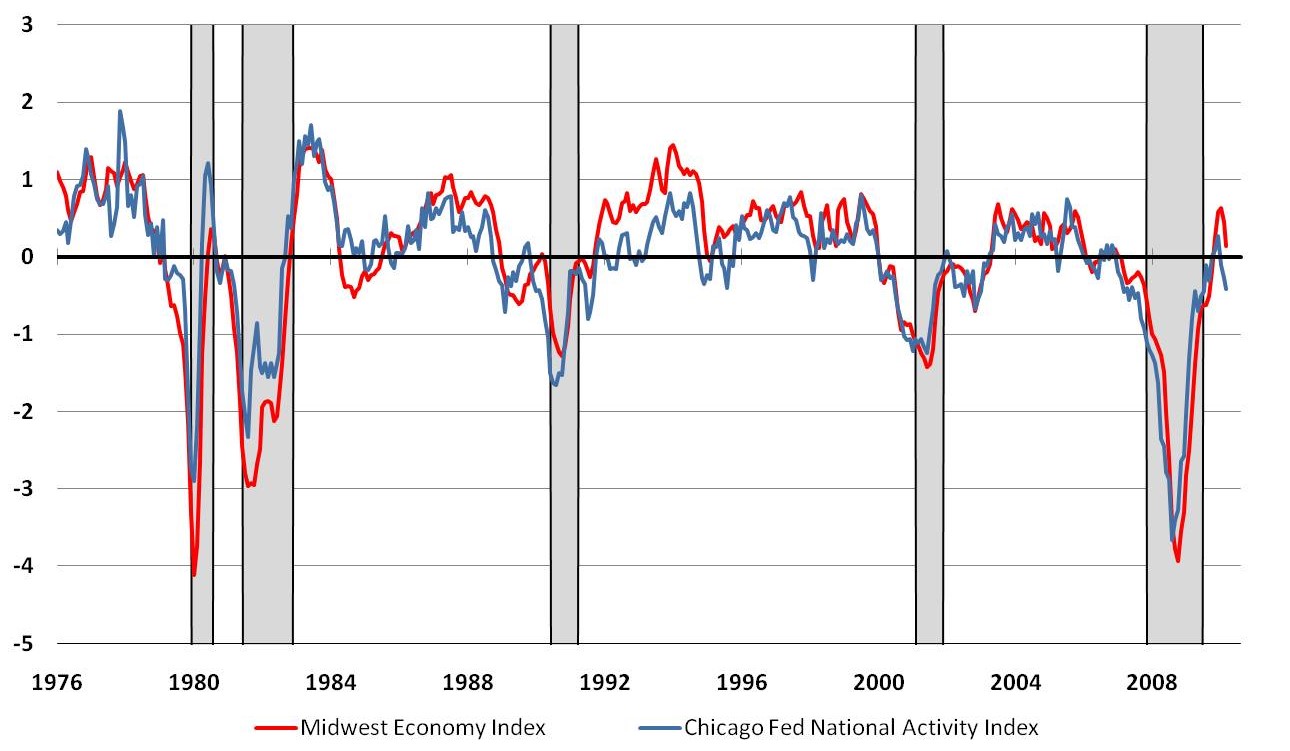
A general picture of manufacturing’s sectoral importance to the region can be seen from the Chicago Fed’s new Midwest Economy Index (MEI).2 The MEI is a weighted average of measures of growth in economic activity. Specific measures can be categorized into variables measuring the consumer sector, services, construction, and manufacturing respectively. Manufacturing-relate variables continue to explain much of the deviation of the “Midwest” region from its own growth trend.3 Figure 1 illustrates the swings in both the MEI and its national activity counterpart, the Chicago Fed National Activity Index. Of particular note, the Region’s overall activity dipped below the nation during the trough of the recent recession. Meanwhile, in the current recovery, due to both quick inventory re-building and to the strong global recovery in world trade and U.S. exports, Great Lakes activity due to manufacturing has been outpacing the nation.
Figure 1. National and regional activity indexes (standard deviation from trend, 3-month average)

Manufacturing and the Long-term
The performance of U.S. manufacturing companies has been and continues to be highly successful in at least one respect. Rapid productivity gains have been achieved through continual investment in modern technology and the adoption of cutting-edge business practices such as inventory management and global logistics. As a result, real output growth per unit of input in the sector has outpaced services. The source of productivity growth has been technological advancements in manufacturing, such as computerization and assembly line engineering, along with process and organizational advances in logistics and production. Many innovations have, in turn, spilled over into service sectors, lifting their productivity as well. The U.S. standard of living has risen accordingly as these productivity gains have translated into real wage gains for workers.
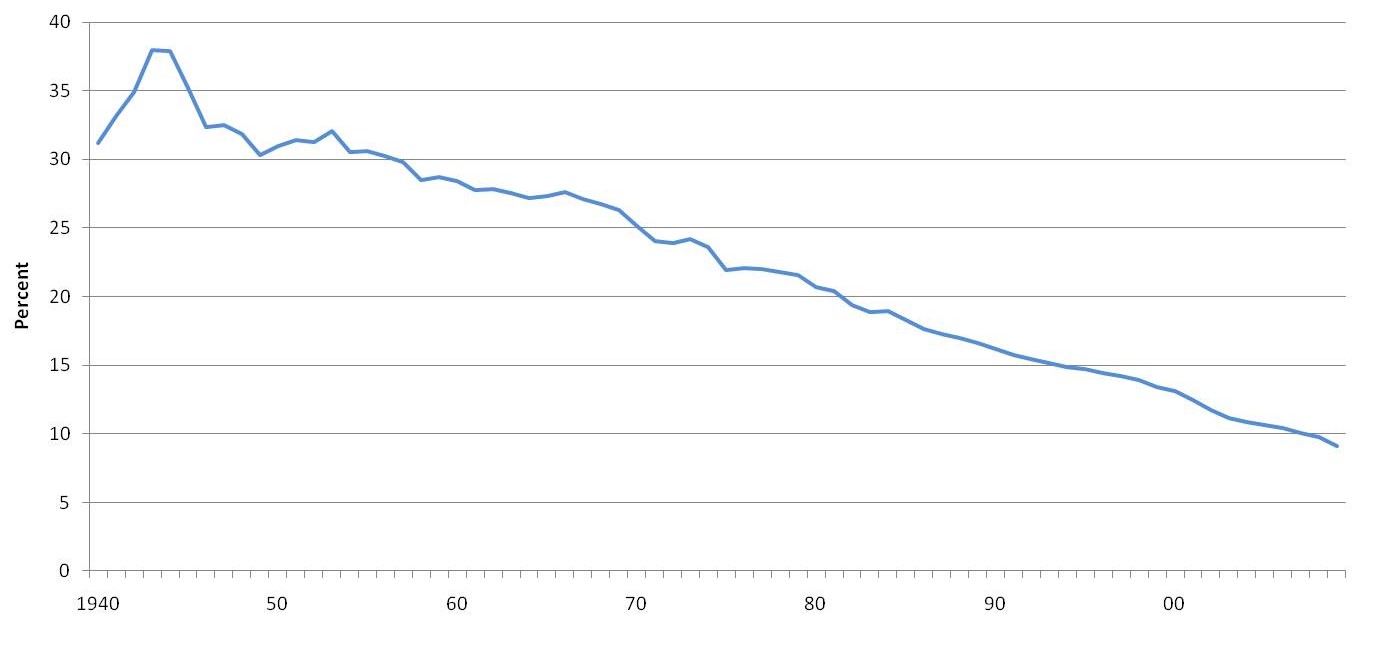
Nonetheless, these productivity gains have cut a different direction for many communities in the Region. While productivity and competition have lowered the prices of manufactured goods for U.S. households, consumers have responded to lower prices by shifting some of their expenditures to services in addition to the goods. Price-responsive in purchasing manufacturing goods has not been sufficiently great to support the Region’s former employment in manufacturing companies. Export sales abroad have back-filled some of the deficiency, but imports have also penetrated important home markets including autos and consumer electronics. The figures below illustrate first that manufacturing jobs have accounted for a declining share of jobs since at least 1947—declining from over one-third share of payroll employment to under 10 percent today. Secondly, the levels of manufacturing payroll jobs have remained largely flat, declining rapidly since the late 1990s. In the Region, manufacturing jobs have fallen more steeply as job location is now shared with the South and the West. U.S. mfg employment fell from 20.5 million in 1969 to 12.4 in 2009, or by 39 percent. Great Lakes manufacturing employment fell from 5.4 million in 1969 to 2.6 in 2009; or by 52 percent over the period.
Figure 2. U.S. manufacturing employment as a share of total nonfarm employment

Figure 3. U.S. manufacturing employment

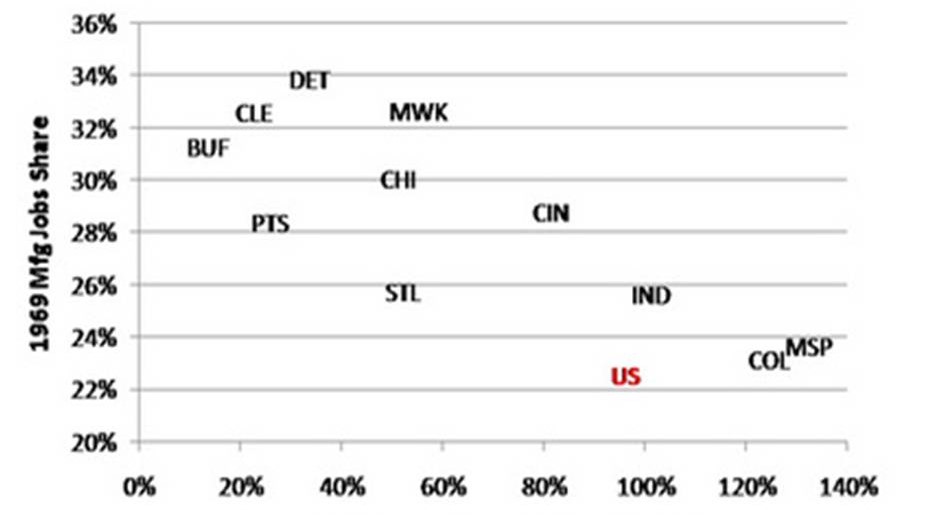
The local effects of the downward drift of manufacturing jobs can be seen with great clarity by comparing the performance of the Great Lakes major metro areas in juxtaposition with their own historic concentration in manufacturing. Eleven major metropolitan areas are charted in Figure 4, running east to west from Buffalo and Pittsburgh to St. Louis and Minneapolis. A strong inverse correlation is evident in observing each MSA’s share of payroll employment in the manufacturing sector in 1969 as compared to subsequent growth in total job growth to 2006. Those metropolitan areas having the highest manufacturing job concentration in 1969—such as Detroit, Buffalo, and Pittsburgh, subsequently experienced the worst total job growth. A similar relationship exists between growth in each MSA’s per capita income growth. For Great Lakes communities, manufacturing has been destiny.
Figure 4. Total employment growth, 1969-2006

False alarms and false starts—the medium term
National business cycles, and the tendency of the Great Lakes Region to amplify them, make forecasting the Region near the time of cyclical episode more uncertain. At such times, the long-term drift in manufacturing seems more helpful in prediction. However, the Region’s performance has not been steady during medium term economic expansions. Rather, performance has been buffeted by special factors and developments such as exchange rate swings, national defense build-downs, savings-and-loan crises, volatile farm fortunes, super-trend national growth, and shocks to specific hallmark industries—especially automotive. In the 1980s, the proverbial bottom fell out of the Region’s economy during the first half of the decade. While much of the nation enjoyed some respite from such events as the micro-electronics revolution, booming oil and gas exploration, and from surging defense re-building, the Midwest languished under a rapidly-rising dollar, trade penetration in steel, autos and machinery, and a farm-debt crisis.
Rapid recovery during the late 1980s made this a distant memory. In fact, by the early 1990s, as the savings and loan financial crisis and defense build-down largely impacted other regions, the 1980s experience came into focus as an aberration to many observers in the Region. In fact, by the mid-1990s, economic performance in the Region returned so such “normalcy” that the lessons of the 1980s were soon forgotten. Import penetration of foreign-domiciled auto makers leveled off amidst the success of Detroit’s new products (i.e. the SUV and mini-van products) and the attendant plunge in real gasoline prices. To be sure, surging imports challenged many domestic markets for manufactured goods, but at the same time, the rapid growth of less-developed nations fed the demand for the Region’s capital goods export industries. High tech manufacturing enjoyed the most rapid growth—mostly outside the Region—during the 1990s. But super-rapid national growth in the U.S. and abroad kept Midwest growth humming.
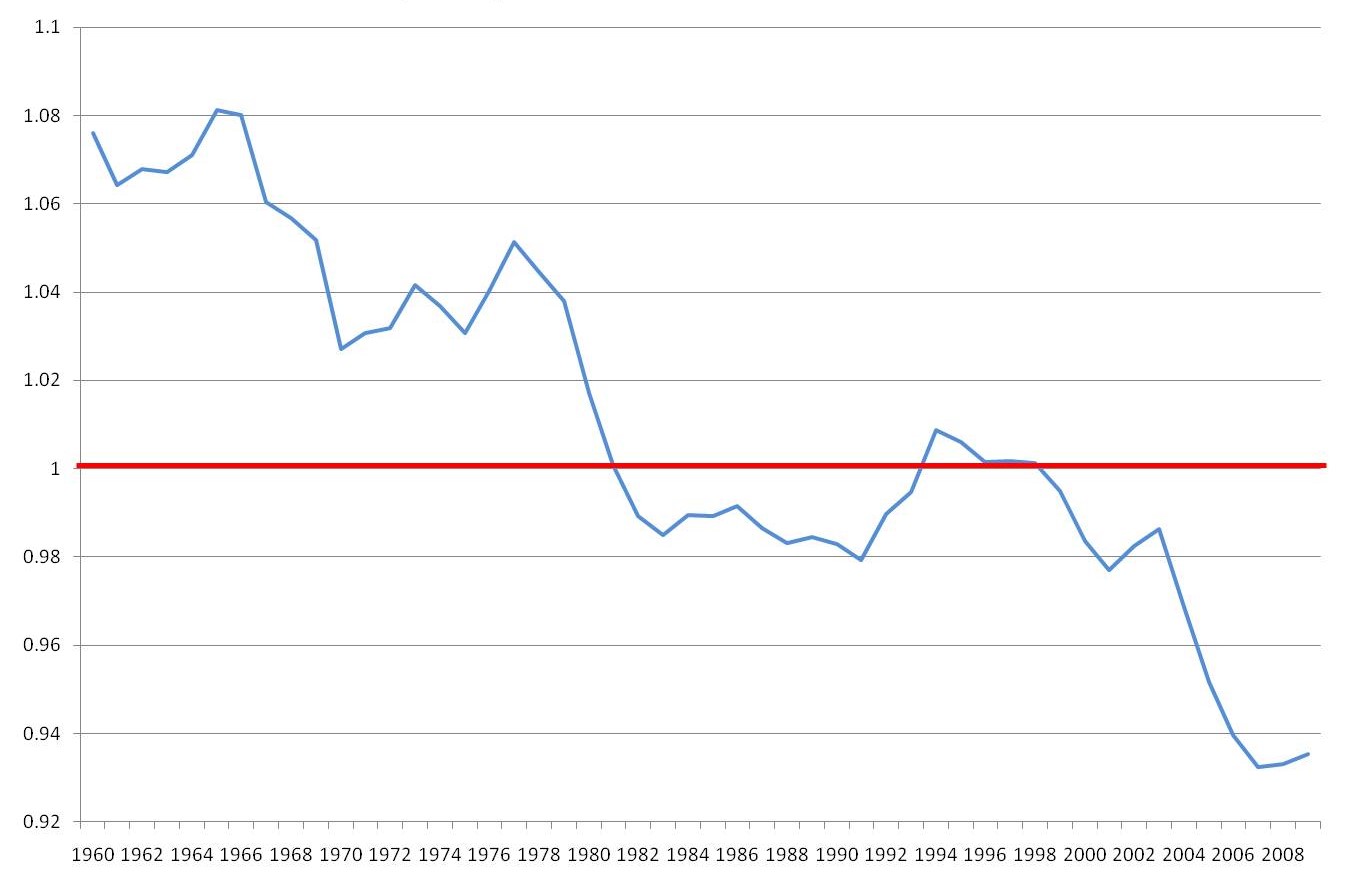
The Region’s per capita income during these periods can serve to illustrate the marked swings in economic conditions. The chart below depicts the Region’s per capita income as a ratio to national per capita income. A ratio of “one” indicates parity between the Region and the nation. Over the course of the early 1980s as the Region’s unemployment soared above the nation, the region’s relative income plummeted, and remained so throughout the decade. But beginning in the early 1990s, fortunes began to change. By mid-decade, per capita income had once again risen above the nation. Surely, regional hopes were raised during this period to the effect that a new and more robust growth path had been set in motion. However, beginning with the economic recessions of the 2000s, it became less clear whether the 1980s were the norm rather than an aberration, and whether the 1990s were also an aberration, or both.
Figure 5. Ratio of per captia income in Great Lakes vs. U.S.

Further evidence and insight concerning volatile and transitory deviations from the Region’s growth trend can be seen from Figure 5. Here, the Midwest Economy Index and the Chicago Fed National Activity Index chart respective growth deviations from each of their respective trends. Throughout the sanguine years of the 1990s decade, the U.S. economy achieved growth rates above its long term trend. Analysts and observers now attribute this performance in part to exuberance associated with the rise of the internet and advanced telecommunications, which lifted profit expectations to levels that later proved unrealistic. Regionally, rapid national growth exerted a salutary effect on growth in the Great Lakes Regions, as did the aforementioned comeback of Detroit auto makers, as well as booming manufactured exports to the developing world.
A Look to the Region’s Future
The tumultuous years following the turn of the 20th century provide little basis for understanding and forecasting the region’s future. Two recessions during the past decade have obscured the true extent of manufacturing’s long term decline, and hence the Region’s prospects. Manufacturing performs very poorly during cyclical downturns. In the same vein, automotive re-structuring leaves the fate of many automotive communities hanging in the balance–dependent on the success of those few assembly companies (and their suppliers) that are domiciled in the Region.
However, the current recovery suggests some respite in which the region can re-direct and re-build. Presently, export recovery and inventory re-building are lifting some of the region’s manufacturing sectors such as steel and machinery upward from a deep trough. At this time, these forces are expected to continue to some significant extent. And a potential re-balancing of the U.S. economy toward greater sales to the rest of the world might also lift the course of the region in a more fundamental way.
Over the long haul, the Region’s sharp concentration in manufacturing makes it impossible to ignore and abandon. Moreover, there is little need to do so. Almost every advanced economy continues to support a vibrant advanced manufacturing sector. The key here is to focus on advanced, technologically competitive, companies and sectors. The Midwest continues to be a superb location for manufacturing, though the challenges are to modernize and innovate.
Some of the Region’s cities are also transforming in positive and encouraging ways. Throughout the developed world, as well as in some developing countries, economic transformation is well underway in those services that are steeped in information flows, educated workers, entrepreneurs, and innovation. To many observers, it is obvious that these activities best take place in urban areas where face-to-face meetings can take place with great frequency and specialization; and where entrepreneurs can best acquire the ideas, business services, and personnel to grow new businesses. The Great Lakes is the domicile of urbanized population on par with the U.S.—slightly below 80 percent. Yet, many of the region’s cities were fashioned as hubs for production and overland transportation of goods, and not as centers of advanced service and finance. Accordingly, the Region’s cities are sorely challenged to re-configure their infrastructure and governance for a different economy. Such challenges are a tall order during the present time when fiscal conditions are stressed, and when the know-how on how to convert older manufacturing land-use forms to the modern age must be discovered and invented, rather than pulled off of a book shelf (or off of an on-line search).
Footnotes
1 This article is drawn from a presentation delivered at the University of Michigan, Ann Arbor, at the Research Seminar in Quantitative Economics, November 19, 2010.
2 See Chicago Fed Letter, no. 280, November, 2010, available online.
3 The MEI’s region overlaps greatly with the Great Lakes except that the MEI does not cover Ohio, but picks up Iowa instead.


