Export Effects of a European Slowdown on the Midwest
As the U.S. economy has shown signs of recovery, attention has shifted to the European sovereign debt crisis and its impact on European economic activity, along with its spillover effects on the rest of the world. In the Midwest, where the manufacturing sector has been leading the ongoing economic recovery, concern has arisen that another recession in Europe could dampen economic activity here too.
What effect might a European recession have on international trade and the manufacturing sector in the Midwest? What do we know from past experience about the sensitivity of trade to changes in economic activity? A recent paper from Chicago Fed economist Meredith Crowley studied the causes of recent trade collapses, especially the Great Trade Collapse during 2008 and 2009. Crowley tested three factors that could potentially affect international trade: declining aggregate demand, financing difficulties, and rising trade barriers. In the past five of six U.S. recessions, the U.S. and the world suffered trade declines as economic activity fell in the two to four quarters before the trough of these recessions. Crowley notes that the elasticity of imports for the U.S. ranged from 1.5 to slightly more than 2 , which implies that imports respond more than proportionally to changes in income and demand (an elasticity of 1 would indicate a proportional response). Based on her own and others’ research, she concludes that a drop in demand is the most important factor in determining trade declines. Trade financing exerts a more modest affect on trade, while rising trade barriers have not been an issue recently.
We might expect similar declines in European demand for imported goods from the U.S. and elsewhere in response to a recession there. How would such developments be felt outside of Europe? To get a sense of how the Midwest, specifically the Seventh District, might be affected, we can ask how exposed the region currently is to trade with Europe—since any drop-off in trade is likely to be somewhat in proportion to current trading patterns. The Seventh District comprises all of Iowa and most of Illinois, Indiana, Michigan and Wisconsin. As seen below in Chart 1, exports to Europe grew for both the U.S. and the Seventh District during the 2000s, but still accounted for less than 2% of GDP for the U.S. and of gross state product (GSP) for the Seventh District in 2010. Therefore, exports to Europe account for a relatively small portion of the region’s economic activity. For 2010, the region’s exports to Europe were worth $31.5 billion, including agriculture and livestock products, oil, gas, minerals, and ores, as well as manufactured goods1.
Chart 1. Percent of GDP exported to Europe

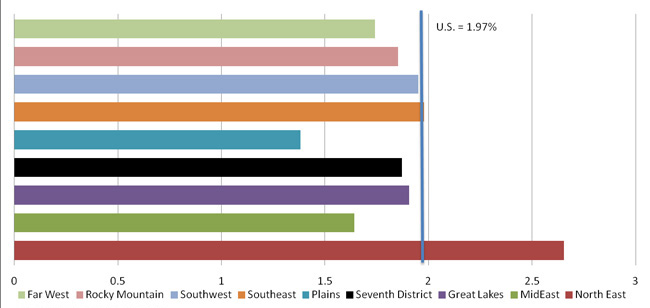
Comparing U.S. regions (Chart 2), the Great Lakes region (which includes Illinois, Indiana, Michigan, and Wisconsin, but adds Ohio and excludes Iowa) lies close to the middle in terms of export exposure to Europe. The Seventh District’s export-to-GSP percentage is almost identical to that of the Great Lakes region, at 1.88% versus 1.91%. The Mideast has the greatest exposure to Europe, with exports accounting for 2.65% of GSP, while the Plains have the least exposure, with only about 1.4% of GSP going to Europe.
Chart 2. 2010 European exports as share of GSP, by region
What do we export to Europe? As shown in Chart 3, chemicals, machinery and transportation equipment, and computer and electronics account for about 70% of all Seventh District exports to Europe. How does the District’s overall export mix compare with other U.S. regions’?
Chart 3. 2011 share of Seventh District exports to Europe, by product type
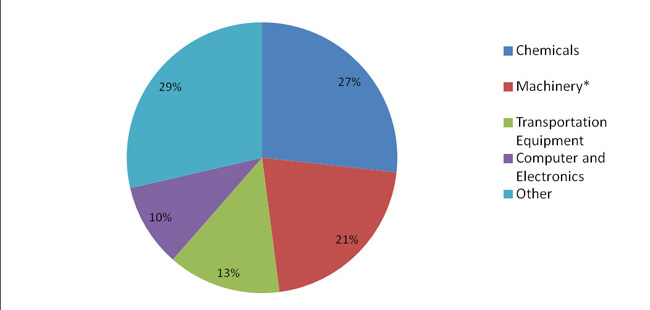
Source: ITA.
The Seventh District’s exports to Europe tend to be more heavily concentrated in three product categories—chemicals, nonelectrical machinery, and transportation equipment. Of our top 10 categories, we overlap with the rest of the U.S. in six of them (Table 1, non-overlapping categories highlighted in red).
Table 1. 2011 top ten exports to Europe
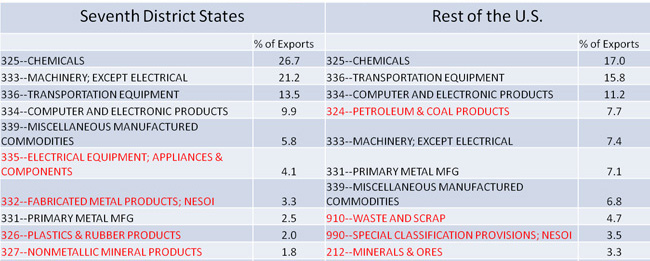
More importantly, our top trade categories are in sectors (industrial goods, such as machinery and equipment, and industrial chemicals) whose sales tend to rise and fall disproportionately with swings in overall business activity. A recent National Bureau of Economic Research working paper noted the procyclical nature of traded goods, specifically durable manufactured goods, and again found that the majority of the decline in international trade was due to a decline in demand for manufactured goods. The authors also find that the decline in the trade of durable goods versus nondurable goods (soft goods like food and clothing) accounted for a larger portion of the decline in total manufactured goods demand in both the recent Great Trade Collapse and the 2001 recession. Therefore, the Seventh District’s reliance on nonelectrical machinery as a top export (21.1% of total exports) could make our region somewhat more susceptible to the negative effects of a European recession than the rest of the U.S., where nonelectrical machinery accounts for a smaller proportion of exports (7.4%).
So, although the Seventh District economy’s exposure to Europe through the export channel is somewhat limited, a slowdown in Europe may be expected to hurt our region’s exports more than those of other regions that export less sensitive products. Exports and imports have historically been sensitive to overall economic conditions. In some cases, such as the 2008–09 global recession, trade declines can be severe.
Footnotes
1 Export data is pulled from the International Trade Administration’s TradeStats Express. Of total Seventh District world manufacturing exports, Seventh District sends about 48% to North America (Mexico and Canada), 19% to Europe, 17% to Asia and 7% to South America. For information on the District’s major trading partners by individual nation, see this blog.


