Government Employment in the Seventh District
There is ongoing discussion about the appropriate and sustainable size of government in our society. At the national level, some of the debate centers on the demographic-driven expansion and long-term sustainability of social benefit programs, such as Medicare and Social Security. Expansion in outlays for such programs has been rapid. Growth in these programs chiefly involves transfers of income across population segments—from wealthier to poorer and from younger households to older ones—rather than expansion of direct government service provision and employment.1
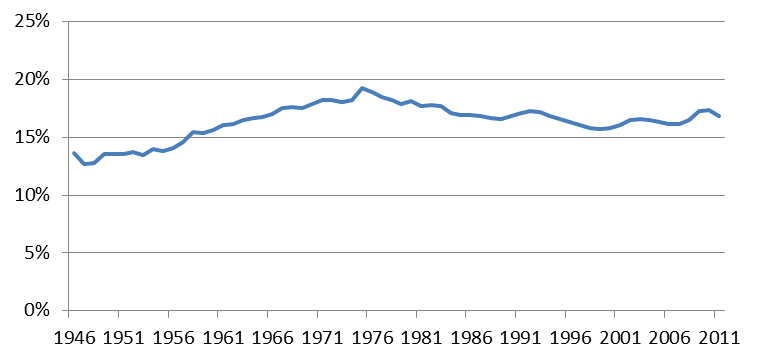
Direct employment by government in the process of program delivery is an important though not-comprehensive dimension of government’s size and importance to the economy.2 Direct employment represents services produced and provided by government agencies, including services such as education, police and fire, and national defense and security. The chart below illustrates government employment as a share of the economy’s “payroll” employment.3 Combined, the three sectors of government—federal, state, and local government—employ between one-sixth and one-seventh of the nation’s payroll work force.
Government employment as a share of payroll employment has not changed appreciably over time. During the post-World War II era, government employment in education grew strongly with the large baby-boom generation. Since that time, the share has been falling at a slow pace.
Chart 1. Government as a share of total nonfarm payroll employment
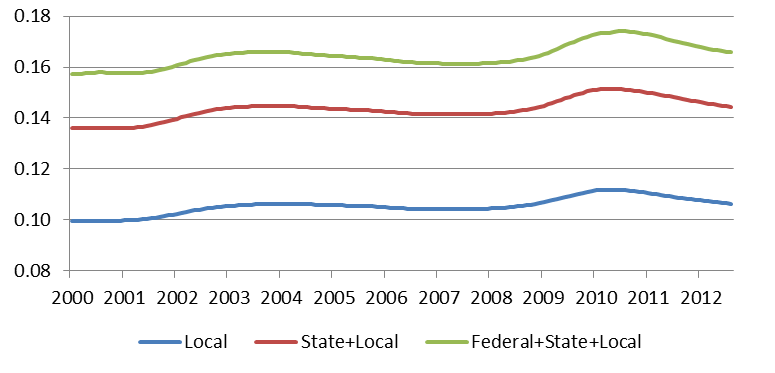
Comparing the nation with the Seventh District, the nation’s average share lies one to two percentage points above the Seventh District average (see chart below). In the District, all levels of government employ 15 percent of payroll workers, compared with 17 percent for the U.S. overall. The chief difference arises from the fact that federal government employment tends to be greater outside the Seventh District. In particular, federal government employment is heavily concentrated in the nation’s capital and surrounding areas in Virginia and Maryland.
Interestingly, the federal government is by far the junior partner in government employment, accounting for only 2.2 percent of payroll employment in the U.S. and 1.4 percent in the Seventh District.4 In comparison, local governments employ over 10 percent of workers in the Seventh District, which is very similar to local government employment across the nation.
Chart 2. District government employment — percent of nonfarm jobs, 12-month moving average
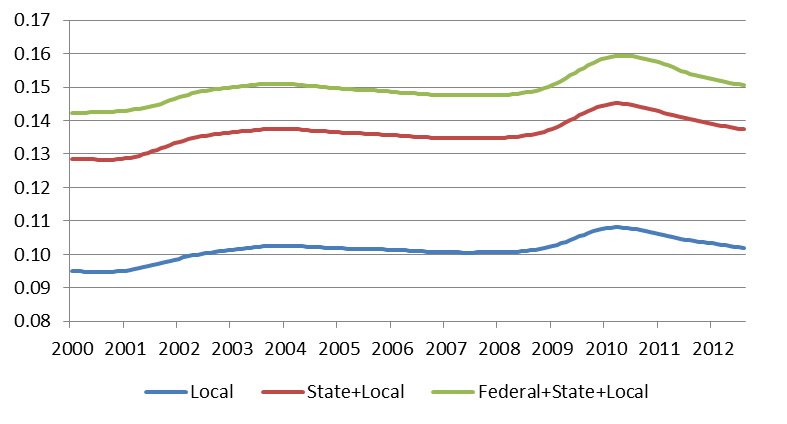
Chart 3. Government employment (U.S.) — percent of nonfarm jobs, 12-month moving averag
Who are the local government employees? The U.S. Census Bureau tabulates employment by the general sector in which workers are serving. The following tables report local government employment for the five states of the Seventh District. For local government, it is clear that school district employment of teachers and non-instructional personnel accounts for the largest share. For 2011, employment of local public school systems in the District accounted for 56 percent of full time equivalent employment (776,000) of overall local government employment. By general category, public safety (police and fire) personnel comprised 9.5 percent of local jobs, followed by health and hospitals (6.2 percent), and higher education (4.1 percent, i.e. community colleges).
Table 1. Seventh District local government employment
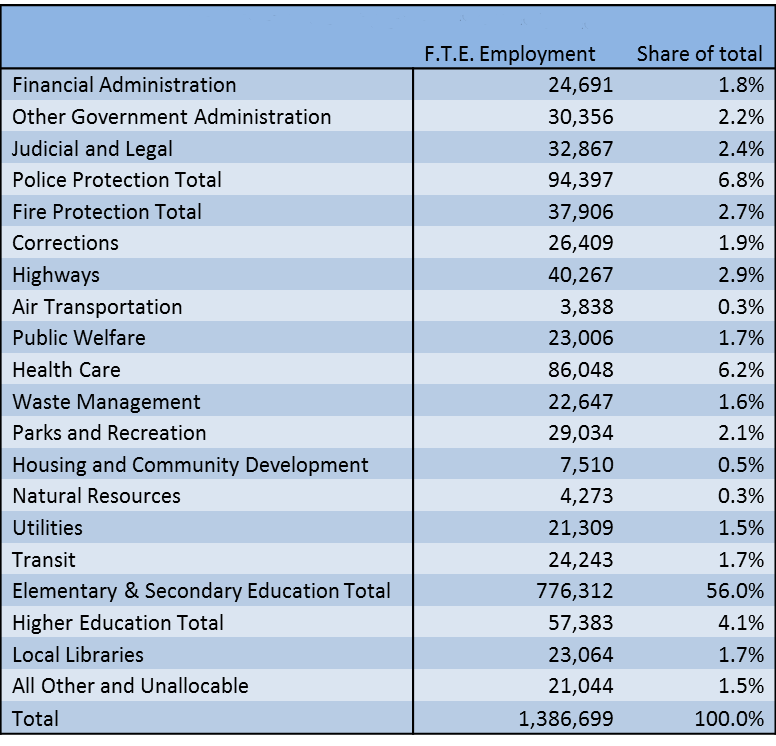
Source: U.S. Census Bureau, available online.
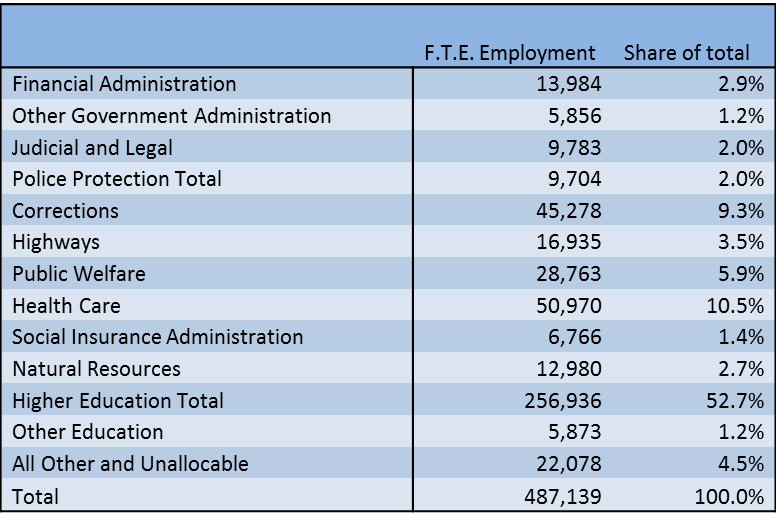
In the Seventh District, state government employment amounts to less than one-half the level of local government.5 Of these, higher education comprises over one-half of state government employment. Unlike local school outlays, state government pays for ever smaller shares of higher education costs. Rather, funding is derived from tuition and fees, grants to university researchers, federal government R&D, and other sources.
Other prominent state government functions include prisons and corrections, with 9.3 percent of District state government jobs (up over 9 percent since 1992). Not surprisingly, at 10.5 percent of state employment, health care has been another growth area in state government. Medicaid expansion accounts for much of the growth of state spending. The federal government picks up at least 50 percent of the cost of Medicaid provision, but the share varies directly according to individual state per capita income measures and other provisions.
Table 2. Seventh District state government employment
Source: U.S. Census Bureau, available online.
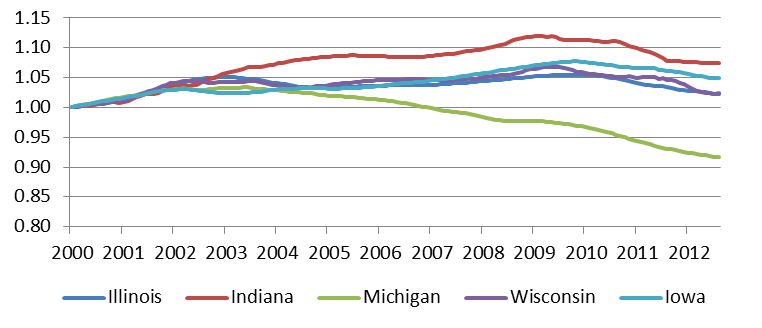
State and local government employment has grown moderately over the past decade. As seen in the chart below, every District state except Michigan expanded employment at a moderate pace over the decade overall, though state and local government employment has been falling over the past two to three years. Locally, the depth of the 2008–09 recession has hit government budgets hard, which has resulted in work force reductions (and service cutbacks) in cities, counties, and school districts. It is somewhat unusual that these retractions in state–local government services and employment have come about during the recovery phase of the business cycle—a time when the government sector has historically tended to support economic recovery rather than weaken it.
Government employment levels were sustained during 2008 and 2009 as the federal government stepped in with increased grant funding for state-local government services, principally through the Anti Recessionary Economic Recovery Act (ARRA). However, as these monies have run out, the devastating effects of the recession on state–local revenues has been revealed through declining levels of personnel.
As seen below, Michigan’s government employment began to fall earlier in the decade as the state’s auto-related economy weakened..
Chart 4. State and local government employment (index) — January 2000 = 1, 12-month moving average
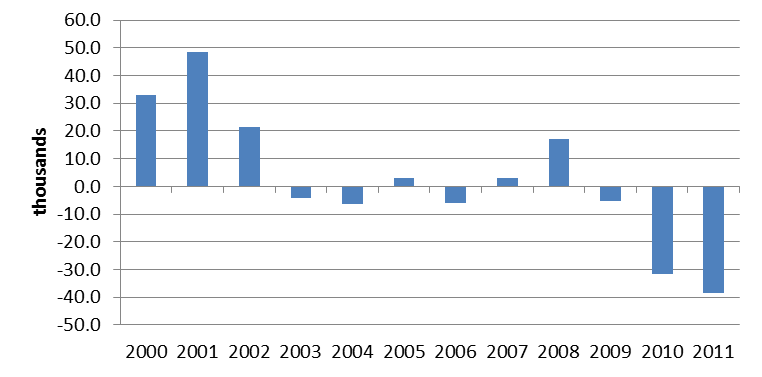
Over the past two years, state and local governments have shed over 70,000 jobs, nearly erasing the gains of the previous years of the decade. Most recently, as the national and regional economies have begun to recover, state and local government fiscal conditions are also strengthening in many locales. Accordingly, over the past few months, the pace of government job declines is beginning to attenuate.
Chart 5. Change in government employment — Seventh District (state and local)
Footnotes
1 Since the 1960s, the expansion of so-called “transfer programs” (which transfer income across household sectors) has been the fastest growing general category of government spending. In particular, prominent programs include OASDI (Social Security) and Medicare, and Medicaid—the joint federal-state government health care program that is targeted at lower income households.
2 Direct employment also excludes purchases made by government agencies in the process of service provision. Among the more important of these, for example, federal government defense agencies contract extensively for military equipment with private sector companies and vendors. Federal government “consumption and investment expenditures” comprise between seven and eight percent of GDP.
3 Payroll employment excludes self-employed persons, who account for about one in nine workers.
4 This excludes military personnel in uniform which amounts to approximately 1.4 million personnel, versus 2.8 civilian payroll workers on federal payrolls.
5 The split between state and local employment is roughly similar throughout the United States except in a few states, such as Hawaii, for example, where the state has assumed responsibility for elementary and secondary education.


