District Unemployment Rates During this Expansion1
In assessing economic conditions among states and regions, we often pay a lot of attention to the current unemployment rate. The unemployment rate measures the share of the work force that is out of work and actively seeking employment. The release of the unemployment rate is timely; it is usually available during the third week following the end of the previous month. Accordingly, when the National Council of State Legislatures asked me to address their January meeting in Chicago and to discuss the economy in the Midwest states, the unemployment came to mind as an expected and known indicator.
The current unemployment rate alone, however, tells us little about how a state economy fares in relation to the current and past swings in economic activity—the so-called business cycle. In the states of the industrial Midwest, for example, unemployment rates often fall steeply during national economic downturns, but often recover rapidly afterward. To get a clearer picture of how these states are doing, I compared each one’s unemployment rate now, 18 quarters following the bottom of the national recession, with its rate 18 quarters following the trough of the past recessions of 1974-75, 1980-82, 1990-91, and 2001. In this way, I can control for demographic differences across states, while also creating a consistent benchmark for comparing unemployment rates at similar points in the national business cycle.
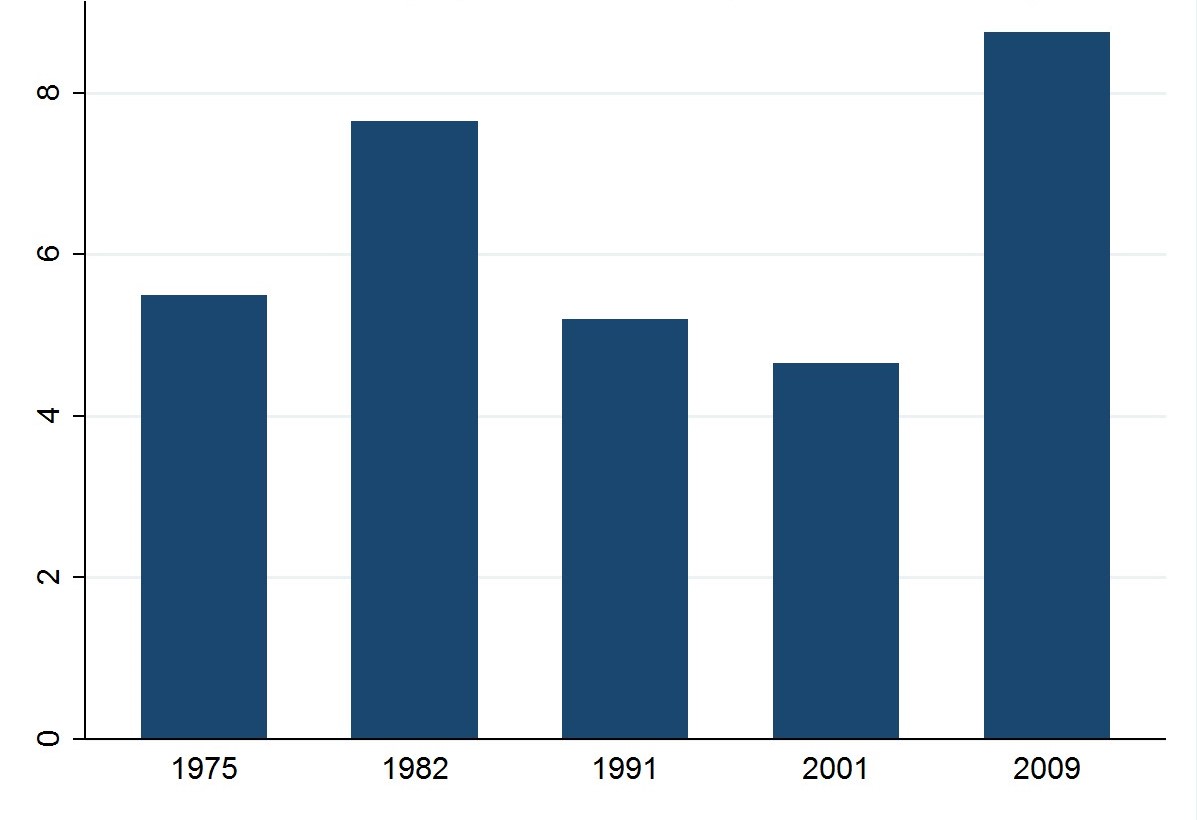
As an example, let’s take the interesting case of Illinois2. The chart below displays Illinois’s unemployment rate for the fourth quarter of 2013, 18 quarters following the trough of the 2007-09 recession. At 8.8%, it is historically very high for this point during an economic recovery and expansion. Clearly, work force conditions are not good. Only the period following the 1981-82 recession rivals this one.
1. Illinois unemployment rates 18 quarters after trough
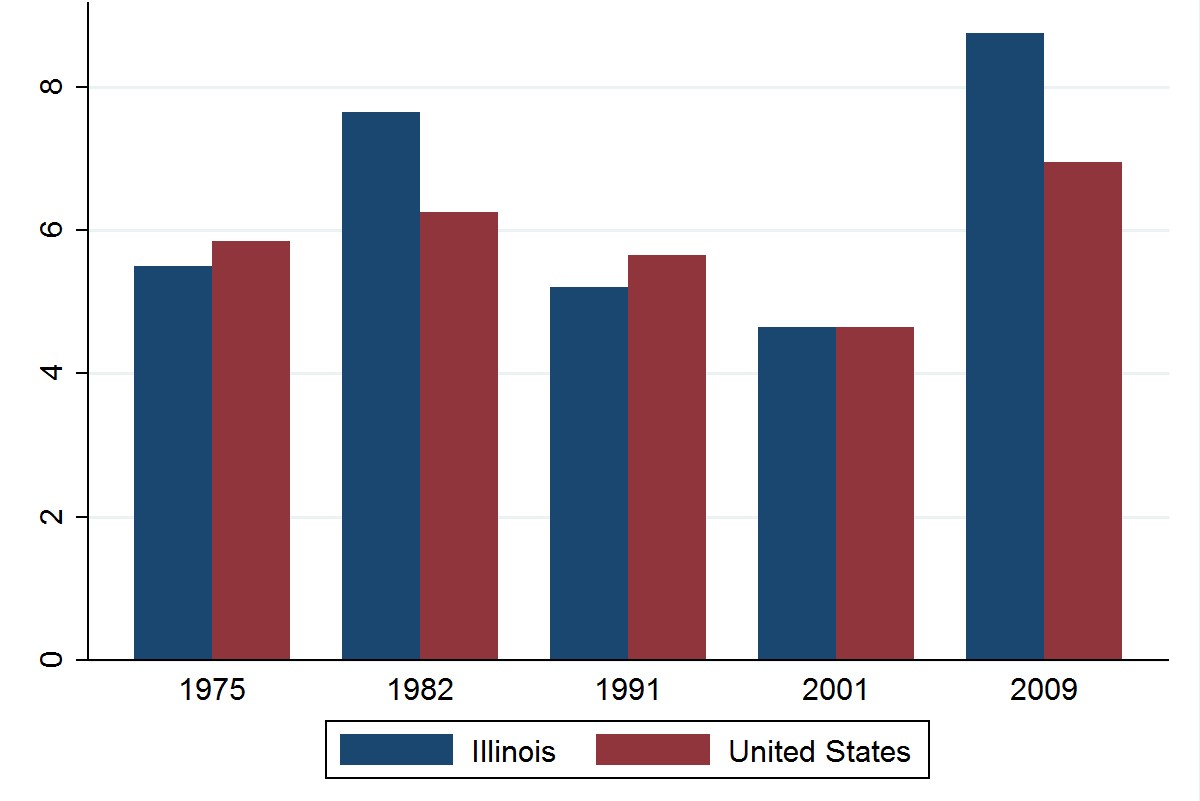
The recession of 1981-82 and its aftermath were severe in both the nation and the Midwest. The nation’s unemployment rate also remained stubbornly high 18 quarters following the 1982 trough. Yet, 18 quarters following that trough, the Illinois unemployment rate still exceeded the nation’s. And in comparison, today’s gap between Illinois and the nation is larger than the 1980s, and indeed larger than in any subsequent period.
2. Illinois and US unemployment rates 18 quarters after trough
While this gives us a pretty good handle on the current unemployment situation, a look at the broader multi-state regional performance is also telling. Multi-state regions are highly interrelated, perhaps none so closely as the industrial Midwest. The line graph below compares the national unemployment rate with that of the East North Central (aka Great Lakes) region, the region with which Illinois is typically grouped. From the chart, one can see that the Great Lakes’ regional unemployment rate soared far above the nation’s during the 1981-82 recession. As many of us recall from that era, everything that could go wrong for the region’s economy did go wrong. In particular, the region’s hallmark manufacturing industries—including steel, machinery, and automotive—suffered steep declines in both domestic and international markets. At the same time, domestic agriculture contracted following rapid but unsustainable growth during the 1970s. Meanwhile, other U.S. regions enjoyed growth driven by rising defense spending and the emergence of high tech industries—principally in computing equipment and micro-electronics.
3. Unemployment rate - seasonally adjusted 3-month moving average
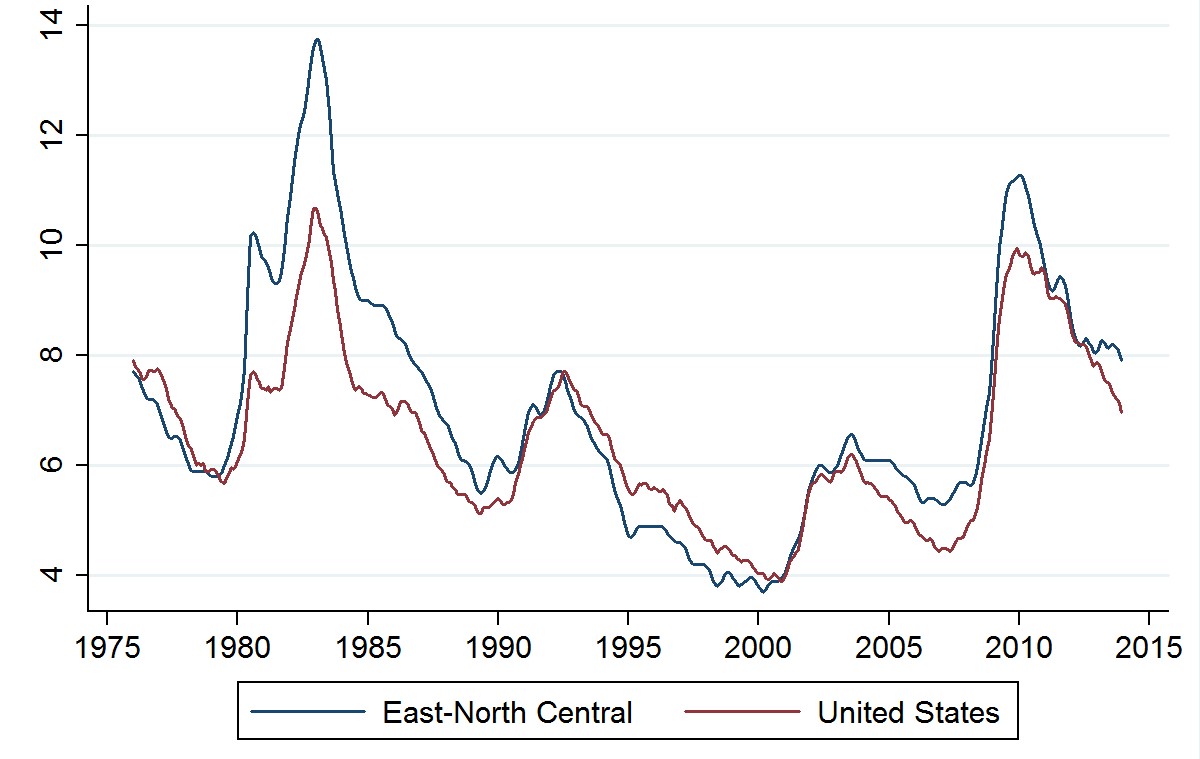
But the recovery from the 1981-82 recession was fast for both the region and the nation and, in the decade following, the Great Lakes region fared even better. Its unemployment rate(s) fell below the nation’s during the 1990s as low gasoline prices spurred the recovery of domestic automotive production and as a growing global economy boosted demand for the region’s capital goods machinery and equipment. Meanwhile, many other regions were held back by local financial (savings and loan) crises, as well as by sagging demand for defense-related goods and services.
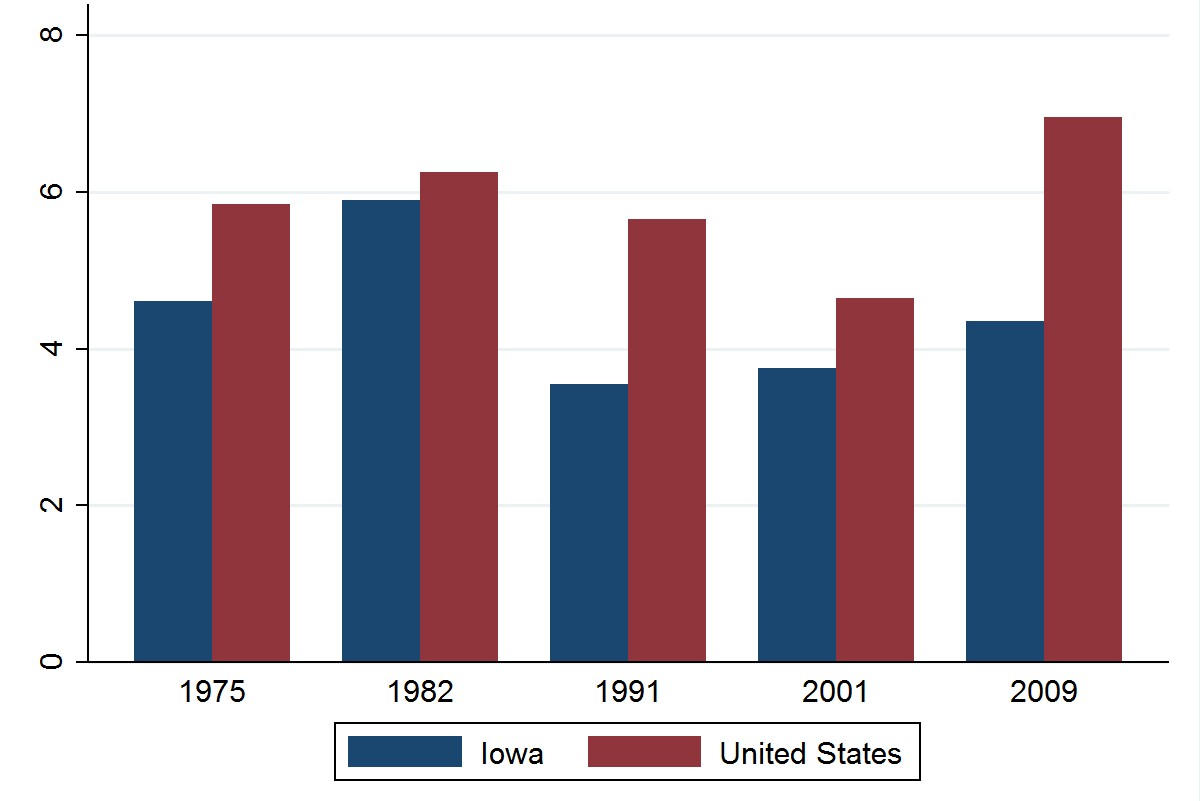
As the line graph above indicates for our more recent expansionary years, the region’s unemployment rate fell quickly following the 2008-09 recession, so much so that parity was reached with the nation during 2011. Since that time, however, the region’s unemployment has flattened, while the national unemployment rate has continued to decline. As a result, a gap has opened up of more than 1 percentage point between the national unemployment rate and that of the region. By way of explanation, the pace of manufacturing growth eased following the bounce-back of the national and global recovery, which exerted an outsized effect on the industrial Midwest. Slowing global growth in Europe and parts of Asia have further dampened the sector’s growth. And so, in the multi-state regional context, Illinois’s recent unemployment gap with the nation is somewhat consistent with the experience of neighboring states. Yet, in comparing the Illinois-U.S. gap to that of the other Great Lakes states, and to neighboring Iowa (below), the Illinois’ gap is large.
Footnotes
1 Thank you to Jacob Berman for research assistance.
2 Charts for the remaining Great Lakes states (and Iowa) are below.
Appendix - Charts for Indiana, Iowa, Michigan, Ohio, and Wisconsin
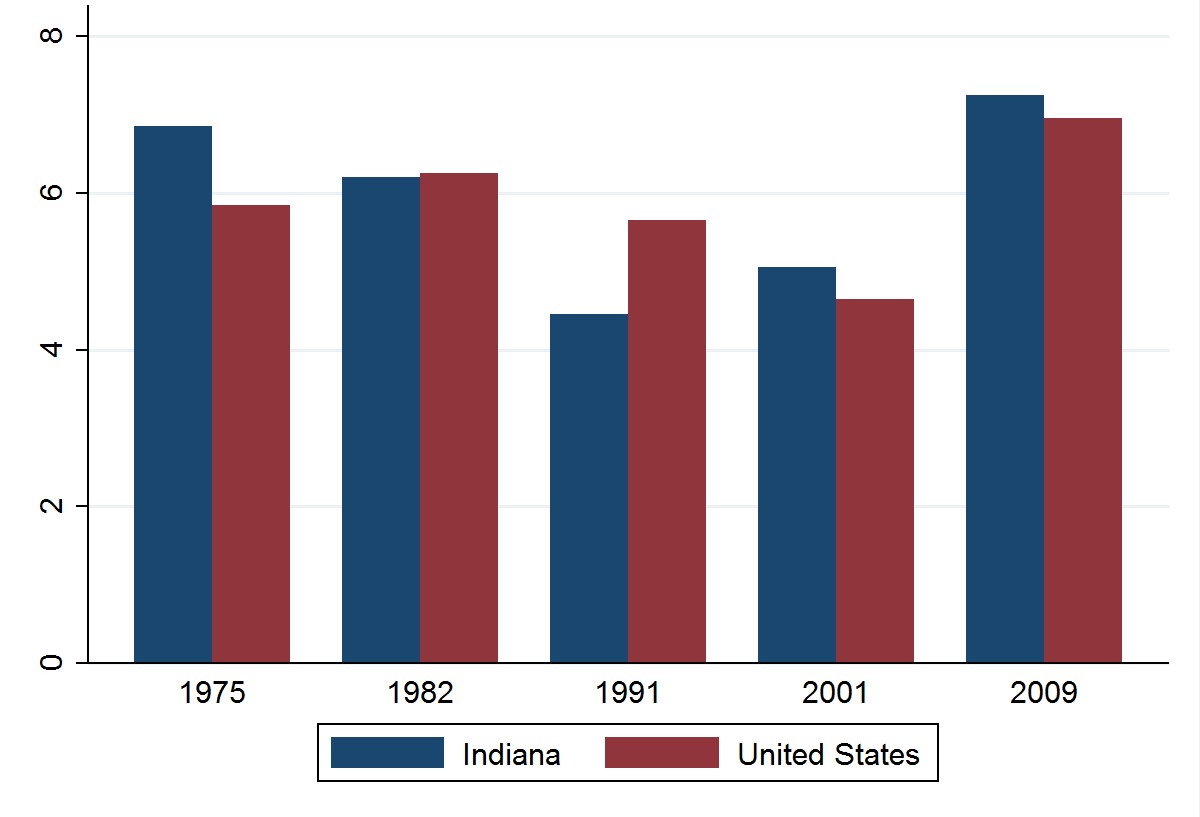
4. Indiana and US unemployment rates 18 quarters after trough
5. Iowa and US unemployment rates 18 quarters after trough
6. Ohio and US unemployment rates 18 quarters after trough

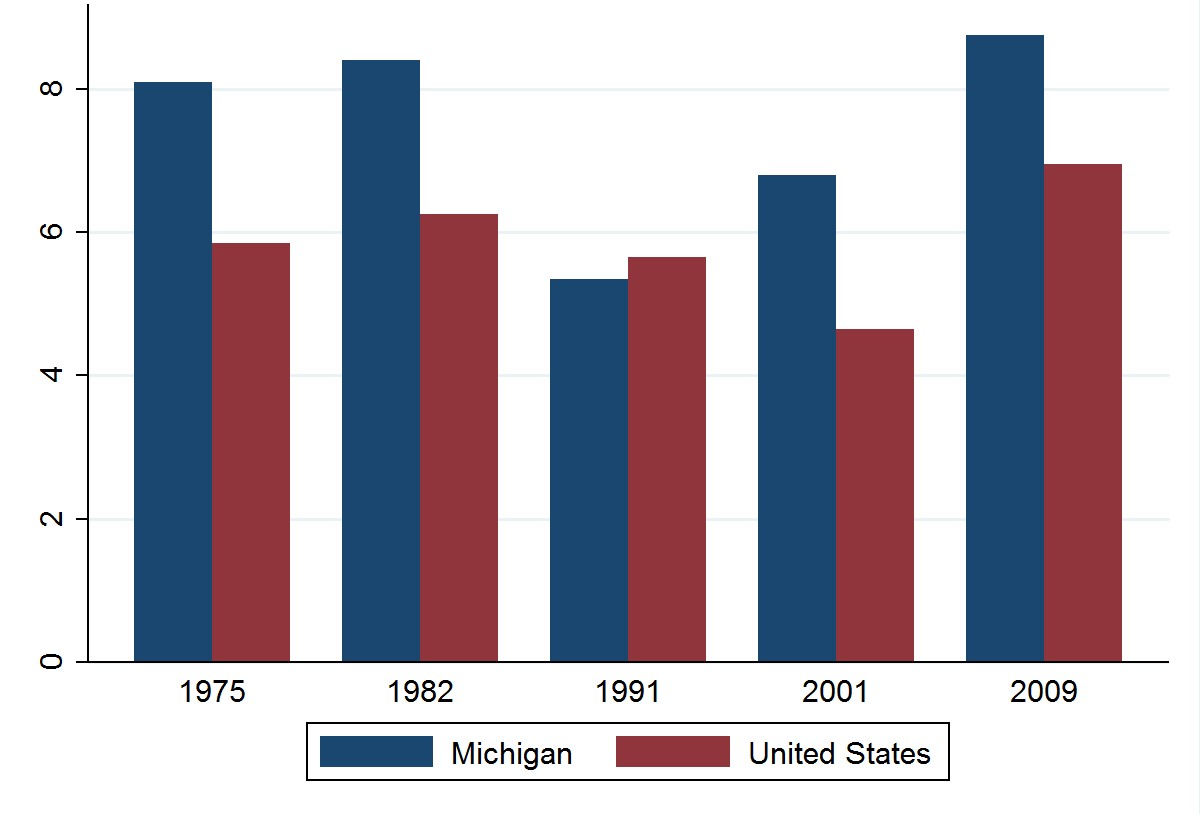
7. Michigan and US unemployment rates 18 quarters after trough
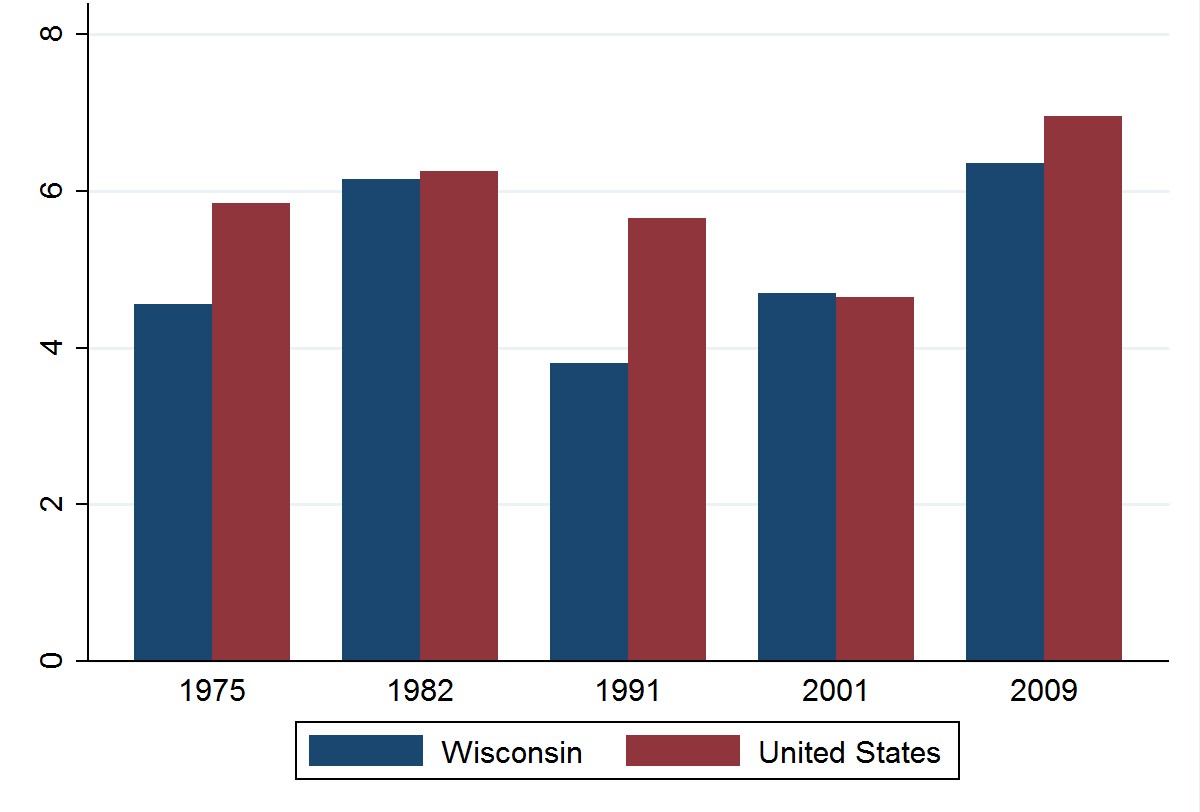
8. Wisconsin and US unemployment rates 18 quarters after trough