2014 in Review: Strength in Manufacturing Led to Solid Growth in the Seventh District
With much of the regional economic data for 2014 now available, it is a good time to look at how the Seventh District1 economy performed last year. While the District had a slow start to the year because of the harsh winter weather, it recovered well in the spring, and finished the year on strong footing. By many measures, 2014 was the best year for the District since the Great Recession ended. The unemployment rate reached new lows, job growth was at its highest, and the average Midwest Economy Index (MEI) reading was the second highest since 2009. A deeper look into the MEI and employment data reveals that manufacturing activity led the way, with particular strength coming from the auto industry. The strong finish to 2014 gives us hope that 2015 will be another solid year on the path to full recovery from the Great Recession.
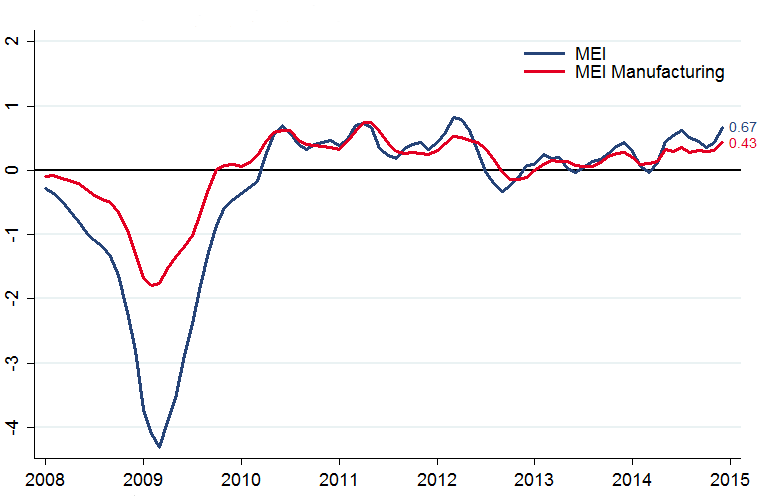
I begin the review by looking at the overall performance of the District’s economy. GDP is the conventional measure we use to track overall performance, but state-level GDP data are published with a six-month lag. For a more up-to-date measure, I use the MEI, which tracks District GDP closely, but is published with only a one-month lag. A positive MEI reading indicates above-average growth, and a negative reading indicates below-average growth. Figure 1 shows the evolution of the MEI since 2008, where the blue line is the overall MEI and the red line is the contribution of manufacturing activity to the MEI.2 For 2014, the trends for both lines dipped to about average growth at the beginning of the year, but activity picked up starting in April and remained well above average for the rest of the year. Manufacturing activity has played a very important role in driving overall economic activity since the recovery from the Great Recession began, and this continued in 2014, when manufacturing activity contributed an average of 70% to the MEI’s positive readings.
Figure 1. Midwest Economy Index
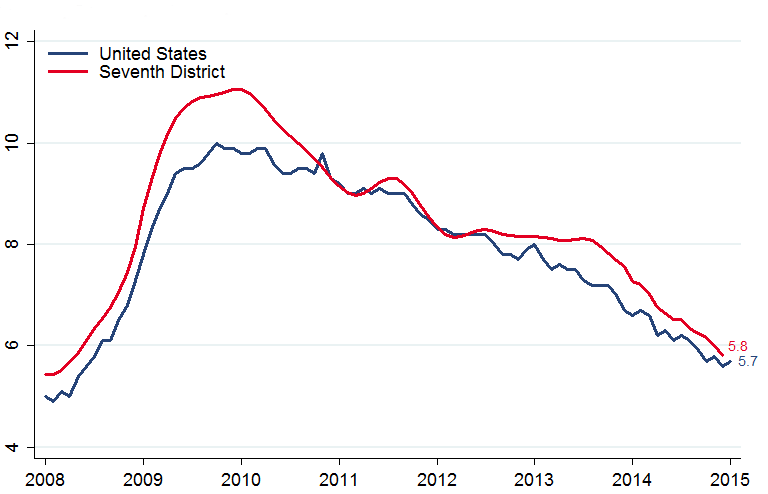
I now turn to economic indicators from the labor market. Figure 2 shows the unemployment rates for the United States as a whole and the Seventh District since 2008. The unemployment rate in the Seventh District improved considerably in 2014, falling from 7.3% in January to 5.8% in December and nearly closing the gap between the Seventh District and the rest of the country.
Figure 2. Unemployment rates
Looking beyond the unemployment rate, we can see in Figure 3 that other measures of labor underutilization also improved in 2014. The four-quarter moving average of the long-term unemployment rate fell from 4% in the first quarter of 2014 to 3.1% in the fourth quarter, while the share of workers who reported working part time for economic reasons fell from 4.9% to 4.3%. Unfortunately, both of these rates are still elevated. The long-term unemployment rate was 2% and the part time for economic reasons rate was 3.2% before the recession hit in 2008.
Figure 3. Unemployment and underutilization
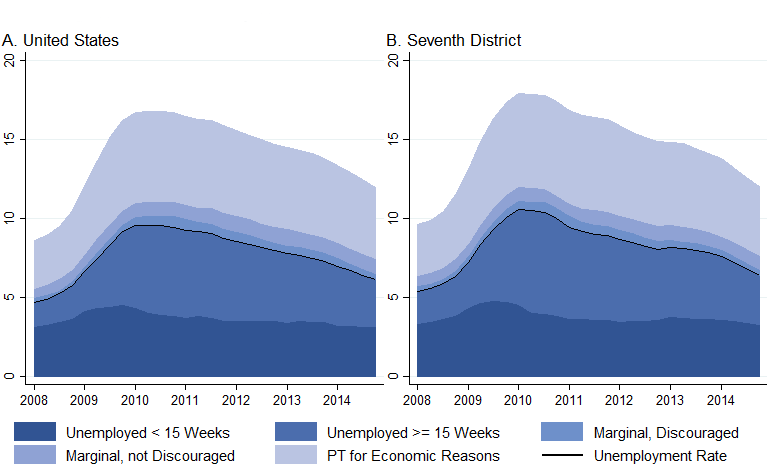
Note: All rates are 12-month moving averages and are a percent of the labor force plus marginally attached workers.
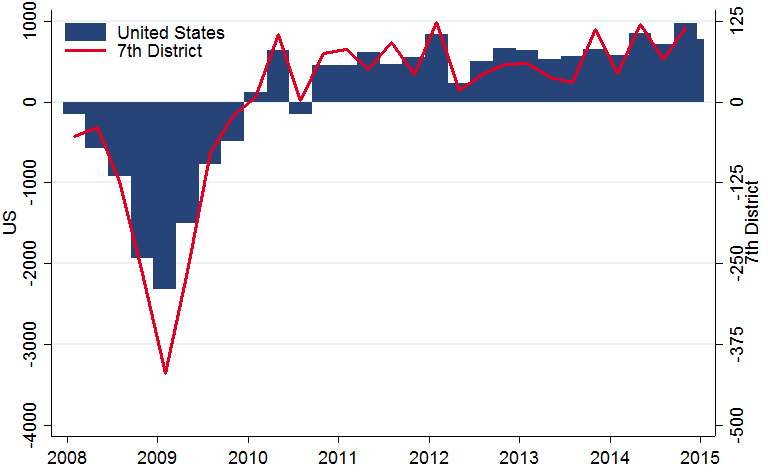
Finally, I look at payroll employment growth.3 Figure 4 shows overall employment growth by quarter for the United States and the Seventh District states since 2008. The first quarter of 2014 was positive but weaker than the following three quarters, reflecting the pattern in the MEI. Overall, the Seventh District added about 345,000 jobs in 2014, the most in any year since the Great Recession.
Figure 4. Employment growth
Payroll employment data are disaggregated by industry, providing one way to understand the sources of growth in 2014. Table 1 shows growth rates for 11 top-level industries sorted by the percentage of overall employment they represent in the Seventh District. I also report each industry’s contribution to the overall growth rate, which is the industry growth rate multiplied by its proportion of total employment. The two largest contributors for the Seventh District are professional and business services and manufacturing, followed by construction and education and health services. Together these four industries contributed about two thirds of the employment growth in the Seventh District in 2014.
Table 1. Payroll employment growth in 2014
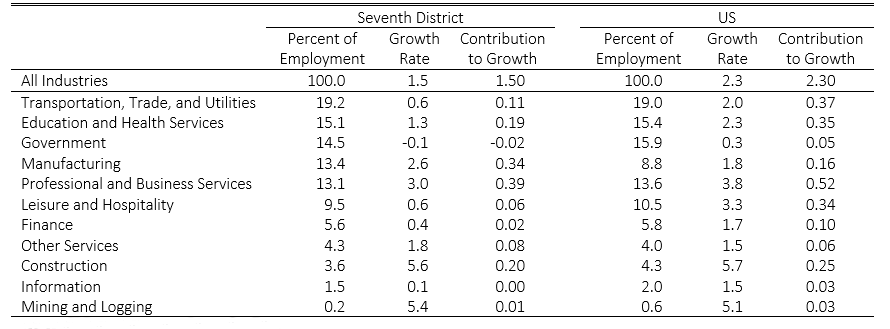
Note: Growth rates are calculated as the percent change from December 2013 to December 2014. The 7th District contributions to growth do not sum exactly to the all industry growth rate because of the early benchmarking procedure discussed in footnote 3.
Next I take a closer look at the two biggest contributors, professional and business services and manufacturing. I start with manufacturing. There are four sub-industries that are large enough in all five District states for the payroll survey to be able to report them. These industries represent 54 percent of all manufacturing employment in the District. Transportation equipment (auto, aerospace, railroad, and ship) was easily the strongest performer, registering a 6% growth rate and contributing about 40% of all the employment growth in manufacturing.
Table 2. Seventh District manufacturing employment growth in 2014
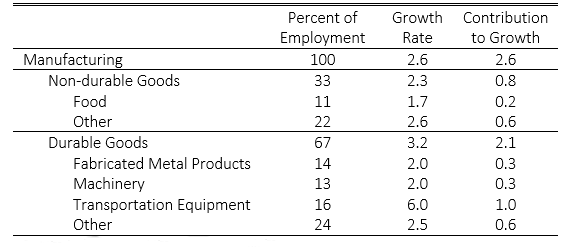
Note: The Seventh District contributions to growth do not sum exactly to the all industry growth rate because of the early benchmarking procedure discussed in footnote 3.
The Professional and Business Services industry has three sub-industries that are large enough to be covered in the payroll survey. Table 3 shows solid growth for professional, scientific, and technical services as well as administrative and support services. It is important to note here that the administrative and support services industry includes labor services firms that contract out temporary workers. Many temporary workers end up at manufacturing firms, suggesting that manufacturing growth was actually stronger than the payroll data indicate.
Table 3. Seventh District professional and business services employment growth in 2014
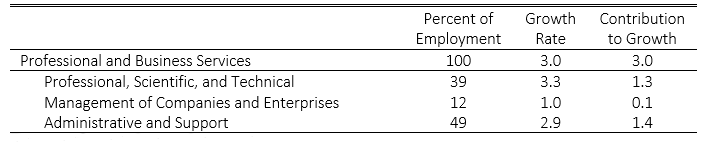
Note: The Seventh District contributions to growth do not sum exactly to the all industry growth rate because of the early benchmarking procedure discussed in footnote 3.
The Seventh District economy did well in 2014. While we are still not at the point where we would consider the economy to be fully recovered from the Great Recession, the District made a lot of progress, and the strong finish to 2014 bodes well for 2015.
Footnotes
1 The Seventh District is comprised of northern Illinois, northern Indiana, all of Iowa, the Lower Peninsula of Michigan, and southern Wisconsin. The analysis in this post uses data that cover the entirety of the five District states.
2 The other sectors in the index are construction and mining, services, and consumer spending. A positive difference between the MEI and MEI manufacturing lines means that overall activity in the other sectors was above trend, while a negative difference means they were below trend.
3 The payroll data come from a monthly survey of one third of businesses and are significantly revised once a year using the Quarterly Census of Employment and Wages, which covers the universe of businesses contributing to unemployment insurance. The data for 2014 have not been revised yet. To get as clear of an idea as possible of what the benchmarked data will be for 2014, I use a slightly modified version of the early benchmarking method described here.


