Fourth Quarter 2019 Review—Seventh District Growth Remained Below Trend
Summary
Growth in the Seventh Federal Reserve District remained below trend in the fourth quarter of 2019 as activity in the manufacturing sector continued to be soft. Slow growth worldwide is one important source of manufacturing’s weakness. Overall, our business contacts expect the pace of growth for their firms to continue to be slow in 2020, and very few expect a steep drop in demand that would characterize a recession.
Now let’s look at some economic indicators that support this summary.
Analysis
As usual, let’s start with two indicators of overall economic activity for the Seventh Federal Reserve District—namely, our Midwest Economy Index (MEI) and the Chicago Fed Survey of Business Conditions (CFSBC) Activity Index. Figure 1 shows the MEI and CFSBC Activity Index together. For this figure, I’ve transformed the CFSBC Activity Index to match the timing and scale of the MEI. In spite of using very different information sources, the indexes typically track each other closely. That has not been the case recently, though: The MEI indicates that growth is the slowest it has been since the Great Recession, but the CFSBC Activity Index says that growth is at about trend. There is no obvious reason for the contrasting readings, but because the MEI takes into account a wider array of data, it is likely a better representation of aggregate activity.
1. MEI and transformed CFSBC Activity Index
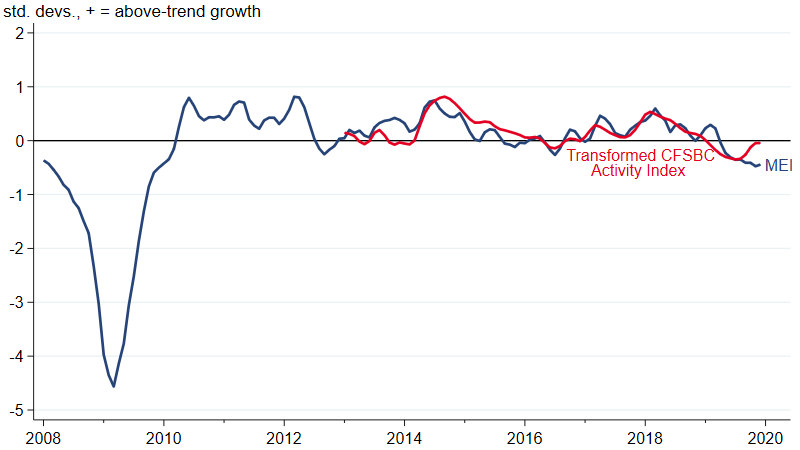
Source: Author’s calculations based on data from the Federal Reserve Bank of Chicago.
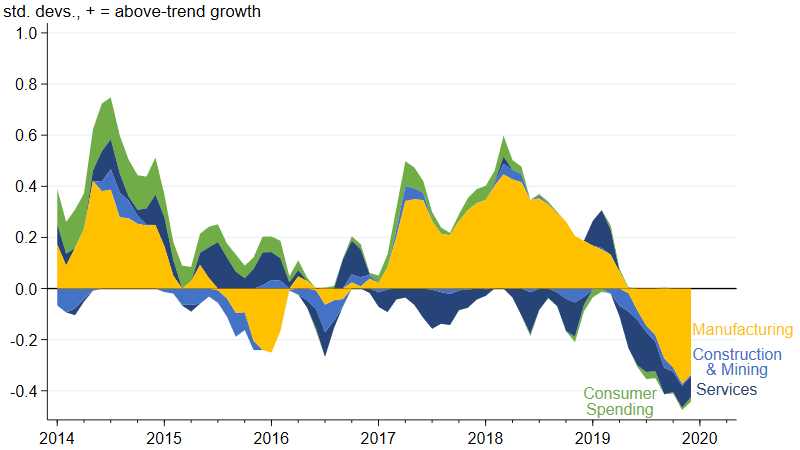
If we look at the contributions from the sectors that make up the MEI (figure 2), we can see that growth is at or below trend for all sectors—with manufacturing making the largest negative contribution to the index by far. We can also see that manufacturing has been the primary driver of the slowdown that started in the middle of 2018.
2. Midwest Economy Index sectoral contributions
What can explain the slowdown in Seventh District manufacturing over the past year and a half? As I’ve been noting for a while now, slower growth around the world has resulted in falling demand for the District’s manufactured goods. The J. P. Morgan Global Composite PMI (purchasing managers’ index) indicates that the pace of global growth started slowing in the second half of 2018 (figure 3). In addition, the Global Manufacturing PMI tells us that Seventh District manufacturers have not been alone in experiencing a slowdown—indeed, figure 3 shows us that manufacturers throughout the world saw growth slow to the point of contraction in the middle of 2019 (manufacturing activity has picked up a bit since then). A decline in trade is perhaps the best explanation for manufacturers’ difficulties. According to the J. P. Morgan Global Manufacturing New Export Orders PMI, new export orders have been declining since September 2018 (figure 4). This is in line with what we’ve been hearing for quite some time from many our CFSBC contacts—that elevated trade policy uncertainty has been clouding their outlooks and making them more reluctant to make new investments, which often involve the purchase of manufactured goods.
3. J. P. Morgan Global Composite, Manufacturing, Services PMIs
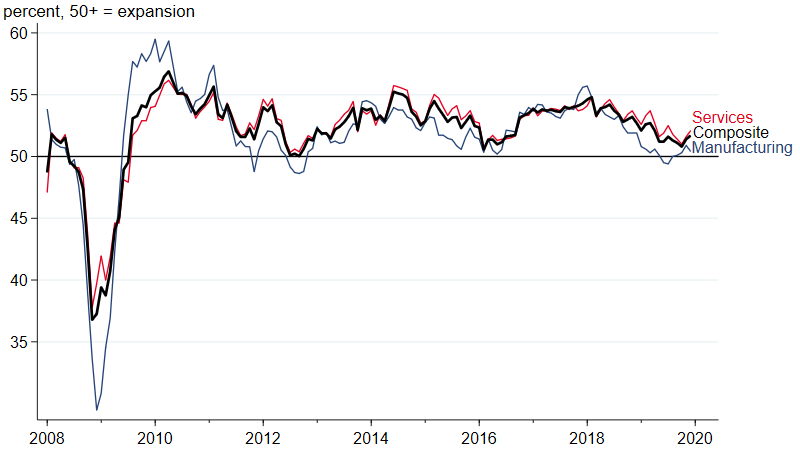
Sources: J. P. Morgan and IHS Markit.
4. J. P. Morgan Global Manufacturing New Export Orders PMI
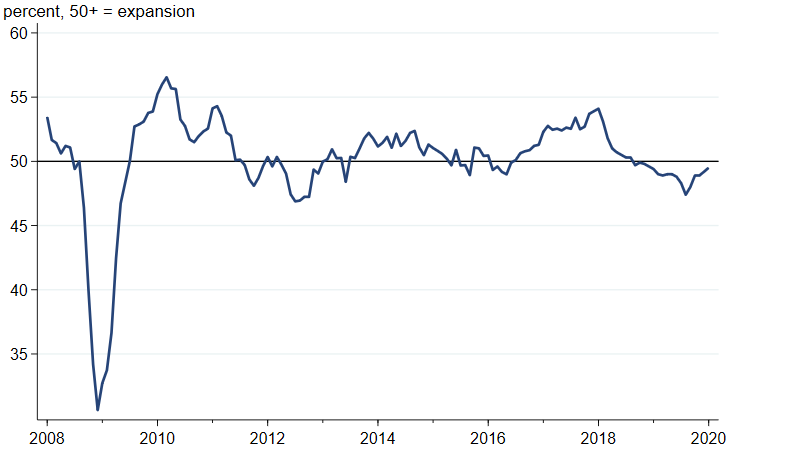
Sources: J. P. Morgan and IHS Markit.
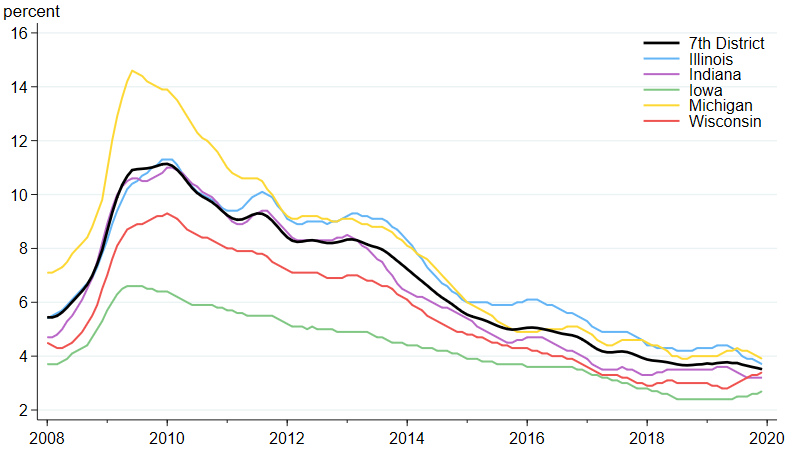
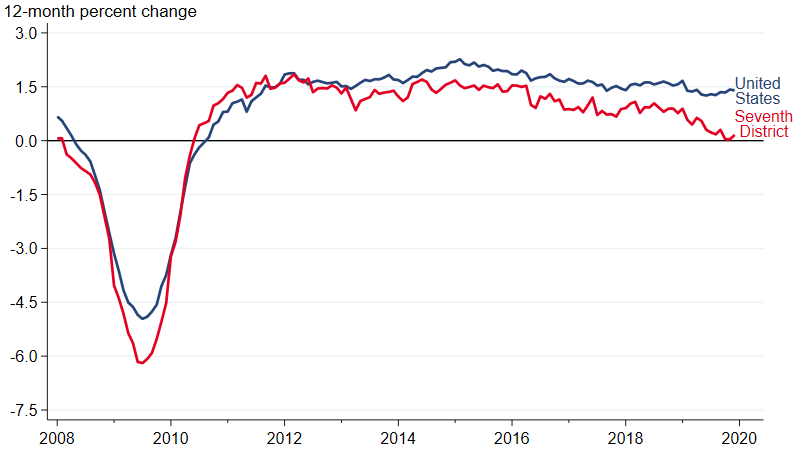
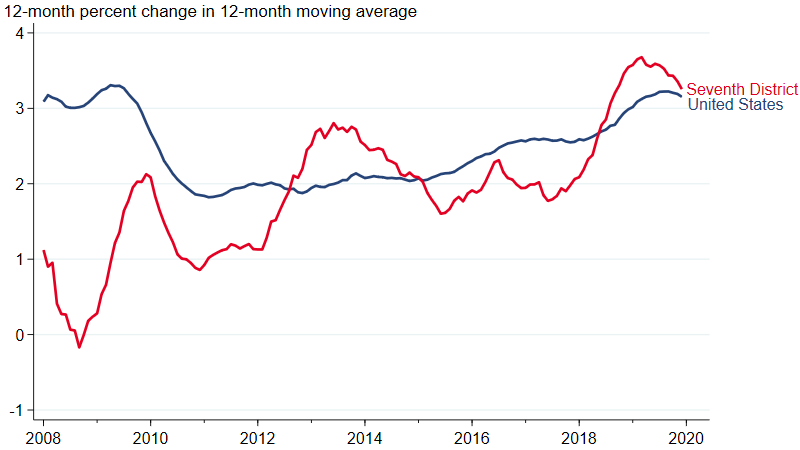
Below-trend growth in the Seventh District has begun to affect the labor market. While unemployment rates are quite low throughout the District (figure 5), employment increased only a tiny bit in the past year (figure 6). In addition, wage growth has decelerated some (figure 7). It is still reasonable to characterize the labor market as being in good shape, but conditions are somewhat weaker than they were a year ago.
5. Seventh District unemployment rates
6. Employment growth
7. Average hourly earnings growth for Seventh District states and the United States
While our CFSBC contacts expect their firms’ growth to continue to be slow in 2020, they do not foresee a steep drop in demand that would characterize a recession. Figure 8 shows the distribution of our contacts’ responses to our question about expected change in demand over the next 12 months. A majority of both our manufacturing and nonmanufacturing contacts expect demand to increase, albeit slightly.
8. Responses to CFSBC question concerning expected change in demand over next 12 months as of 1/15/2020
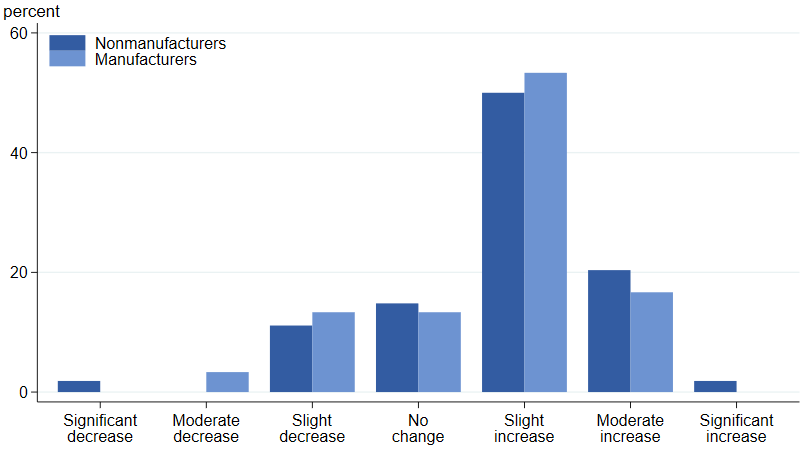
Source: Federal Reserve Bank of Chicago.
Conclusion
The Seventh District’s pace of economic growth was below trend in the fourth quarter of 2019 as slow global growth continued to hurt manufacturing. Weak growth is affecting some important labor market indicators, but overall, the labor market remains healthy. Our business contacts expect the economy to continue to expand in 2020, with limited concerns about the possibility of a recession.


