“Early Benchmarking” the State Payroll Employment Survey
One of the most important sources of information we have on current economic conditions is the Bureau of Labor Statistics’ (BLS) Current Employment Statistics (CES) program (also known as the payroll survey). The payroll survey reports monthly estimates of nonfarm payroll employment, hours, and earnings at the national, state, and metro area levels. Because the CES covers only a representative sample of employers, the BLS is able to release the results of the survey in a timely manner (typically three weeks after the reference month at the U.S. level, eight weeks after at the state level, and ten weeks after at the metro area level). At the same time, relying on a survey—instead of a census—means the results are subject to sampling error. The BLS does revise the CES estimates to address sampling error. With each new monthly release, it adjusts the two previous months’ estimates; and once a year in March, it revises the two previous calendar years at the U.S. level and the five previous calendar years at the state and metro area levels.1 In this blog post, I discuss a method pioneered by researchers at the Dallas Fed to predict the once-a-year revisions at the state level as many as nine months in advance. These predictions can provide valuable information, because state-level revisions can be substantial.
For their state CES estimates, the BLS relies primarily (but not entirely) on a sample of about one-third of the universe of employers that participate in states’ unemployment insurance (UI) programs. The information on employment and earnings from all employers participating in UI is eventually reported under the BLS’s Quarterly Survey of Employment and Wages (QCEW) program, with a delay of six months from the reference period. As noted above, in March of each year, the BLS revises state-level CES data for the prior five calendar years, using the previously unavailable QCEW data as a benchmark.2 It is important to note here that QCEW is only a benchmark (not the final answer), because the CES and the QCEW do not cover the same universe of workers. The CES does not count farm workers, but it does count the 3 percent of nonfarm workers who do not receive unemployment insurance. The QCEW only counts workers with unemployment insurance, which includes some farm workers. Because their universes are not exactly the same, the CES and QCEW have different levels. However, they overlap enough that their trends are about the same.
While the BLS rebenchmarks the payroll survey data once a year, the QCEW data are released four times a year (three months at a time). And because the payroll survey uses the QCEW as its benchmark, it is possible to use newly released QCEW data to predict how the BLS will eventually revise the CES data. For example, table 1 shows when the new QCEW data used for the March 2015 rebenchmark became available. Data for the fourth quarter of 2013 were available nine months before they were used to benchmark the CES. And by December 2014, it was possible to have a good idea of how the CES would be revised through the second quarter of 2014, even though the BLS had only revised the CES through the third quarter of 2013.In what follows, I explain a method for “early benchmarking” the state payroll survey data pioneered by researchers at the Dallas Fed (explained by them here). I then look at how the method performed at predicting the March 2015 revisions for the five states in our Seventh Federal Reserve District.
Table 1. New QCEW data availability prior to the March 2015 rebenchmark
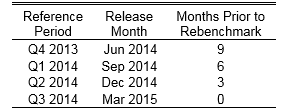
Note: The BLS was able to incorporate Q3 2014 QCEW data into the March 2015 rebenchmark.
The method begins with the last month of CES data that are benchmarked to the QCEW. From then on, monthly changes are calculated using growth rates from the (seasonally adjusted) QCEW, not the CES. Once the QCEW data run out, monthly changes are again calculated using the CES. In essence, the method amounts to substituting in growth rates from the QCEW data that are newly available but have not yet been used to benchmark the CES.
Figure 1 shows the early benchmarking method visually for the Seventh District states using the data available in December 2014.3 The blue line is the CES, where the dashed portion of the line represents months that have not been benchmarked by the QCEW. The green line is the QCEW; and it is clear that while the CES and the QCEW have different levels, their trends are quite similar. The red line is the early benchmarked version of the CES. The solid portion of the red line is the path generated by monthly growth rates from the QCEW, and the dashed portion of the red line is the path generated by monthly growth rates in the remaining CES data.
Figure 1. Seventh District employment (thousands)
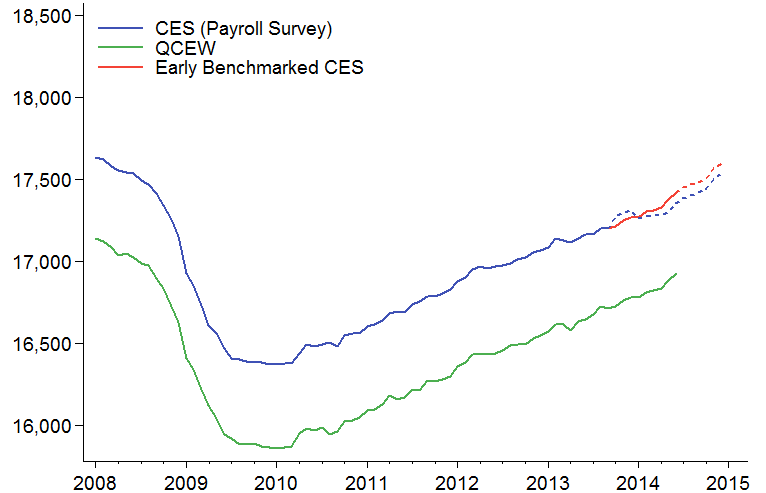
Note: Dashed lines represent data that have not been benchmarked by the QCEW.
How did the early benchmarking procedure do at predicting the March 2015 CES rebenchmark? Figure 2 shows the revised payroll survey data from March 2015 in black. The QCEW-benchmarked data now go through the third quarter of 2014. Overall, the early benchmarked CES series appears to predict the most recent rebenchmarking of the CES better than the March 2014 rebenchmarked CES series does. This is especially true before the QCEW data run out in June 2014.
Figure 2. Seventh District employment (thousands)
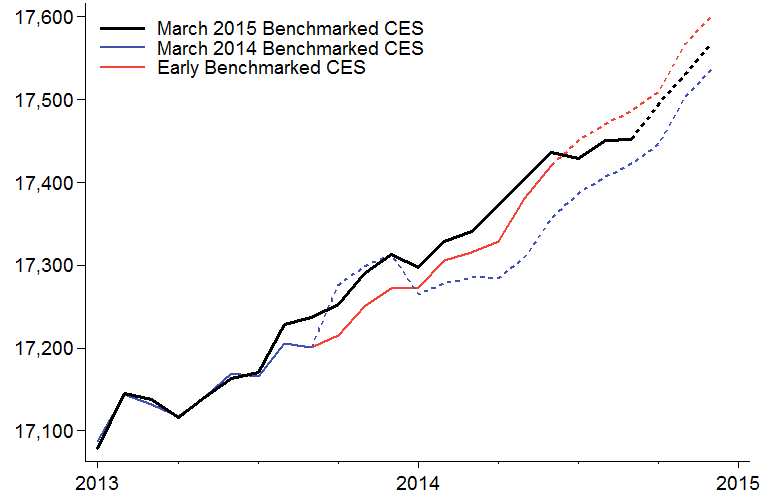
Note: Dashed lines represent data that have not been benchmarked by the QCEW.
One way to measure the accuracy of a forecast is to calculate its root mean squared error. Table 2 shows the root mean squared error for predictions of the March 2015 rebenchmarked CES using the March 2014 rebenchmarked CES and the early benchmarked CES. The early benchmarked CES performs as well or better at both the District and state levels. At the District level, the early benchmarked CES is typically about 31,000 jobs off, while the March 2014 rebenchmarked CES prediction is typically about 51,000 jobs off. In the case of Michigan, the early benchmarked CES performed substantially better. Figures 3 through 7 show the state-level comparison. Taken as a whole, these results demonstrate that early benchmarking the CES provided a tangible improvement in measuring growth in the Seventh District over the last year or so.
Table 2. Root mean squared errors of predictions of the March 2015 rebenchmarked CES
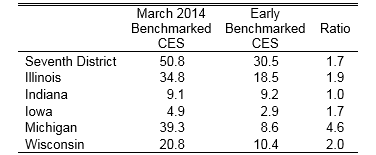
Note: Employment data are reported as thousands of workers.
Figure 3. Illinois employment
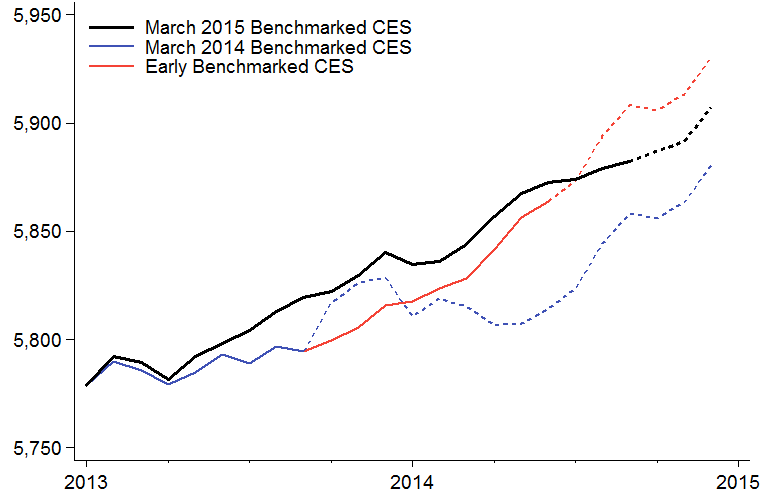
Note: Dashed lines represent data that have not been benchmarked by the QCEW.
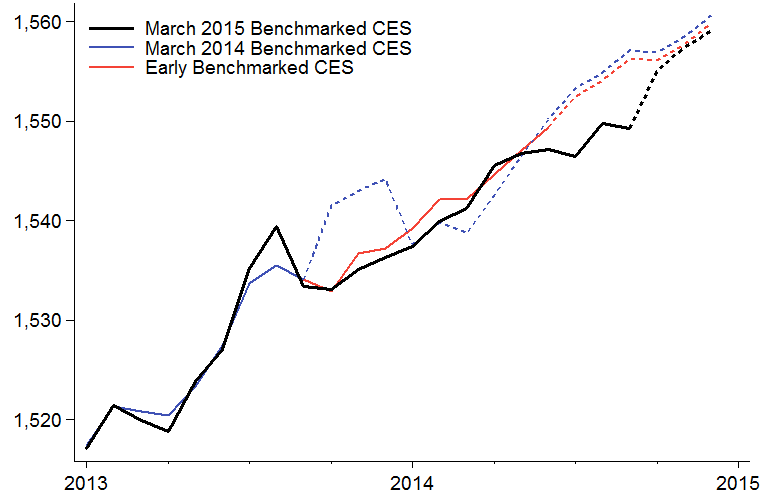
Figure 4. Indiana employment (thousands)

Note: Dashed lines represent data that have not been benchmarked by the QCEW.
Figure 5. Iowa employment (thousands)
Note: Dashed lines represent data that have not been benchmarked by the QCEW.
Figure 6. Michigan employment (thousands)
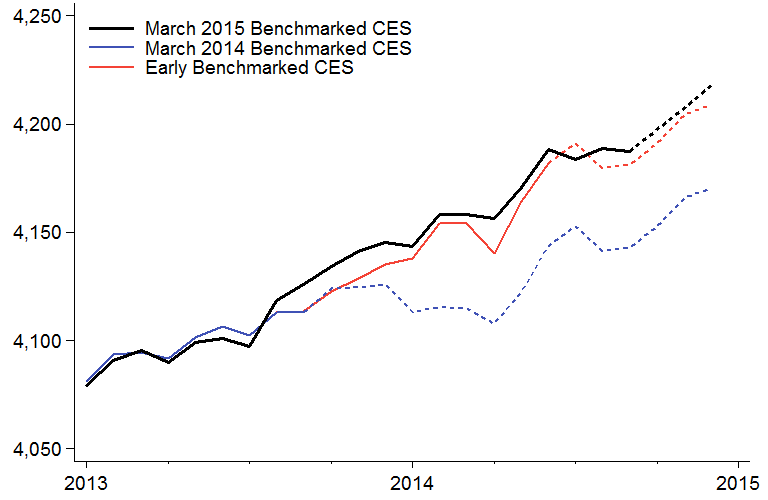
Note: Dashed lines represent data that have not been benchmarked by the QCEW.
Figure 7. Wisconsin employment (thousands)
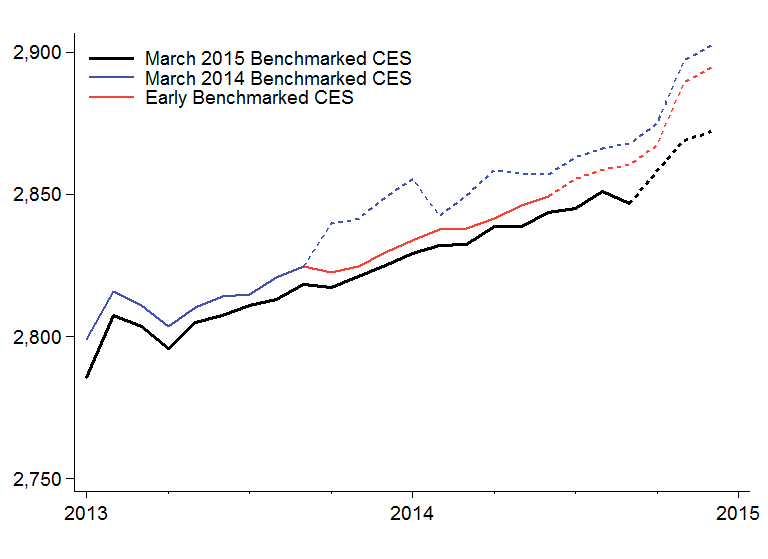
Note: Dashed lines represent data that have not been benchmarked by the QCEW.
Footnotes
1 For example, in March 2015, the BLS revised data for 2013–14 at the U.S. level and 2009–14 at the state and metro-area levels.
2 While the new QCEW data only cover the previous year, the revisions go back five years because the BLS also recalculates its seasonal adjustment factors.
3 I calculate the early benchmark series for the Seventh District by summing the early benchmark series for the District states.


