Measuring Tax Capacity for Municipalities in Cook County
Illinois’s fiscal situation will likely require tax and revenue increases. How might we assess a municipality’s tax capacity, or ability to “absorb” a larger tax bill? In our previous blog, we reviewed various methods of assessing tax capacity. Now, we use the municipal-gap method to estimate tax capacities for Cook County municipalities.
The municipal gap is the difference between revenue capacity and expected expenditures. We estimate revenue capacity by multiplying the total equalized assessed property values (EAVs) in each municipality by a standard tax rate-the rate required to bring the total property tax revenues of Cook County municipalities in line with their total expenditures on non-school municipal services. Our measure of (own-source) revenue capacity excludes intergovernmental transfers. We predict expected expenditures based on estimates of each municipality’s socioeconomic and physical characteristics. Finally, we subtract expected expenditures from revenue capacity to get the municipal gap. A positive gap implies that a municipality has a larger tax capacity, and a negative gap implies a smaller tax capacity.
In practice, this analysis need not be restricted to municipalities located within one county. However, differences across counties in property assessment practices, as well as the quality and composition of services provided, may distort differences in the municipal gap. Restricting the sample to Cook County municipalities should limit differences due to these extraneous characteristics. To this end, we also exclude municipalities with smaller populations (those with populations below the 25th percentile for Cook County). Consequently, results from our analysis can be generalized to a subset of Cook County municipalities and expenditures, namely general government, which largely consists of public safety expenditures.
Data Sources and Calculations
Non-school municipal expenditures and EAVs were obtained from the Illinois Comptroller’s Fiscal Year 2014 Annual Financial Report.1 In the report, expenditures are categorized according to their reported functions (e.g., public safety) and governmental fund (e.g., general fund). We calculated non-school expenditures by combining all reported expenses across functions and funds. Revenue capacity was calculated by multiplying each municipality’s EAVs by a standard tax rate, which is the aggregate Cook County expenditures divided by aggregate EAVs; the resulting rate is 12.8%. Both expenditures and revenue capacity are normalized across municipalities by expressing them in dollars per capita.
Estimates of socioeconomic and physical characteristics were obtained from the Census Bureau 2014 American Community Survey 5-year estimates.2 We separated characteristics into two groups: environmental and control variables. Environmental variables are assumed to be more exogenous to the choices of local officials and are used to predict expected expenditures. They include the unemployment rate, poverty rate, population density, and population (logged). In contrast, control variables are assumed to be less exogenous, and either failing to control for these factors or using them to predict expenditures may bias our predictions of expected expenditures. Control variables include the percentage of the population ages 25 and older with a bachelor’s degree or higher, income per capita, the percentage of housing units that are owner-occupied, the median age of the population, and whether the municipality owns or operates a public utility company (this last measure comes from the Comptroller’s report).
Brief Data Summary
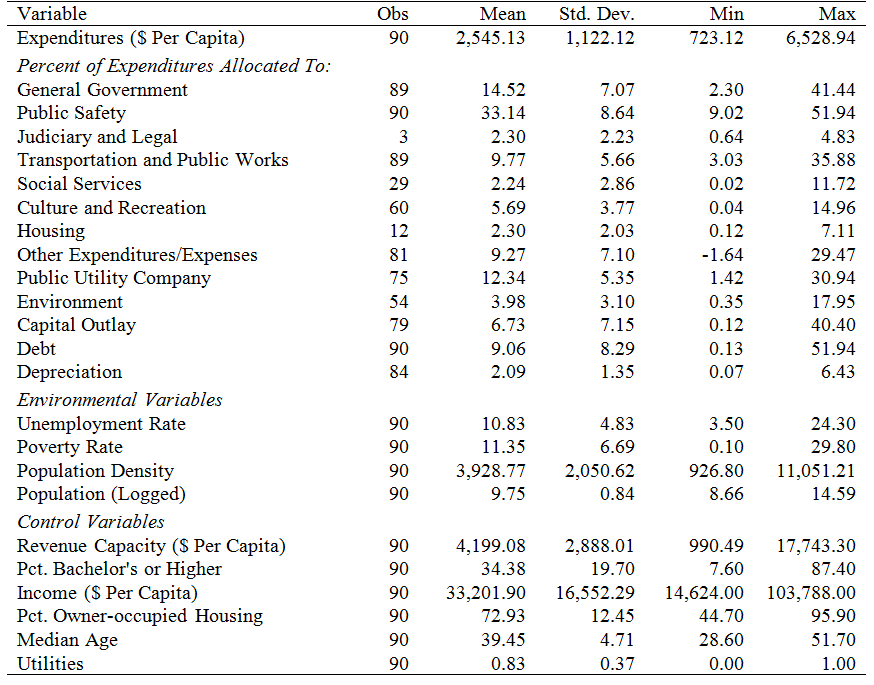
Table 1 provides descriptive statistics on expenditures, revenue capacity, and the environmental and control variables. On average, a municipality spends $2,545 per capita on non-school services. Cook County municipalities allocate, on average, 33% of non-school expenditures to public safety, and only 2% to social services. The large gap between average revenue capacity ($4,199 per capita) and average expenditures underscores the fact that we exclude a large portion of all expenditures municipalities face, such as those appropriated to overlapping governments. The sizes of standard deviations reflect substantial heterogeneity in the compositions of expenditures across municipalities, in particular for debt and capital outlay. The minimum value for the other expenditures/expenses category in part reflects reimbursements.
Table 1. Descriptive statistics
Calculating Municipal Gaps
We use regression analysis to derive expected expenditures. First, we estimate the effects of environmental variables on the dependent variable, actual municipal expenditures, while holding constant the control variables. Second, we predict expected expenditures using a municipality’s actual values of the environmental variables and the estimated effects.
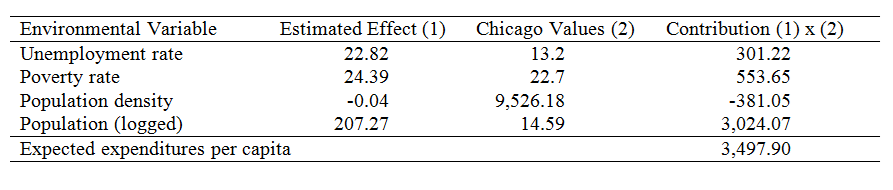
Table 2 provides results from estimating the effects of environmental and control variables on non-school municipal expenditures. Altogether, we could find no evidence that the environmental variables affect municipal expenditures, controlling for additional factors. In addition, the adjusted R-squared value suggests that we explain roughly 40% of the variation in expenditures (around its mean). Table 3 provides an example of calculating expected expenditures for the City of Chicago (values were rounded to 2 decimal places). Multiplying a municipality’s actual values for the environmental variables by each variable’s corresponding effect results in that variable’s contribution to expected expenditures; summing all the contributions leads to expected expenditures. The final step in the analysis is subtracting expected expenditures from revenue capacity, resulting in the municipal gap.
Table 2. Regression results
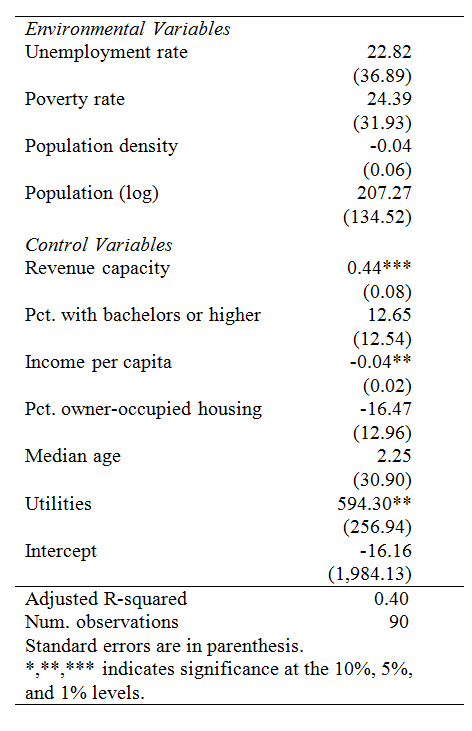
Table 3. Example calculation — city of Chicago
Results and Conclusion
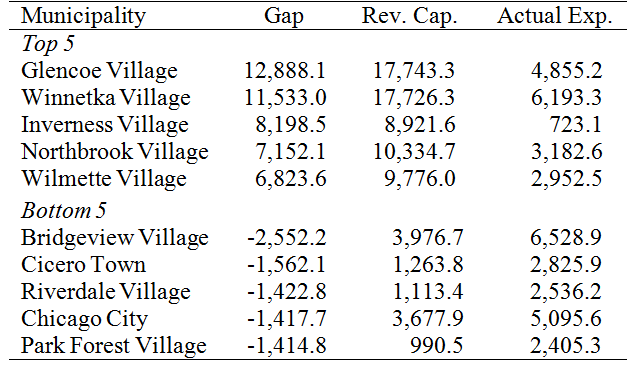
Table 4 displays the results for municipalities with the largest and smallest gaps. Glencoe Village is assigned the largest positive gap, with an additional $15,846 in revenue per capita available after appropriating funds for expected expenditures. In contrast, Park Forest Village would require an additional $1,802 in revenue per capita to fund its remaining expected expenditures. How do the results of the municipal gap analysis using expected expenditures compare to those using actual expenditures? Table 5 provides findings for the latter scenario. Results for all municipalities included in our study may be obtained here.
Table 4. Largest and smallest municipal gaps
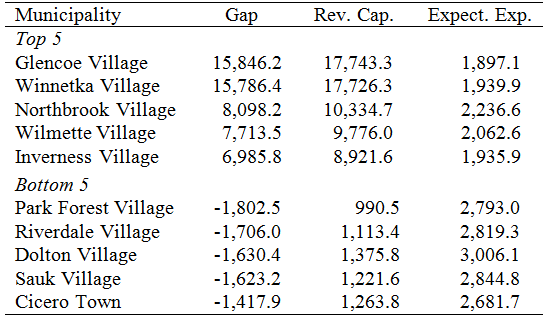
Table 5. Largest and smallest actual gaps
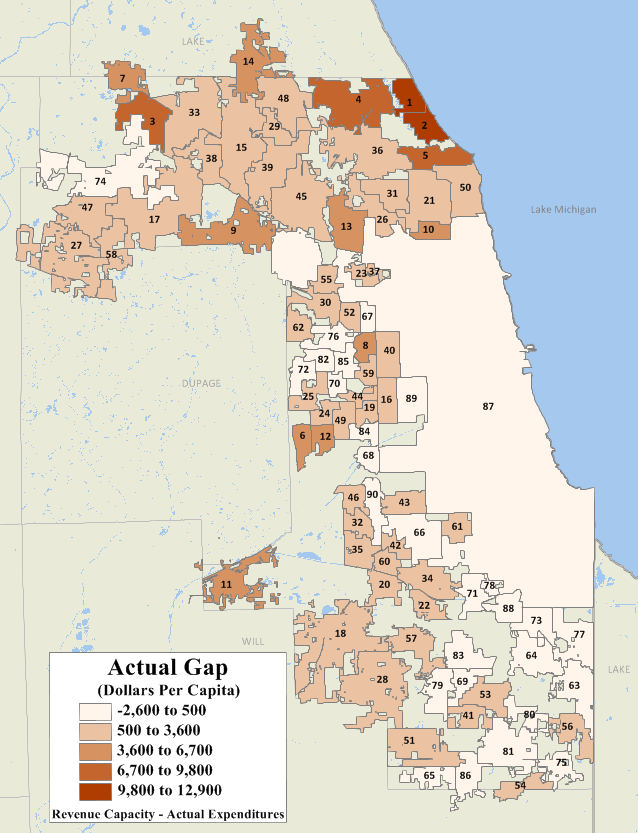
Mapping the municipal gaps illustrates the geographic discrepancies in tax capacity. Figure 1 displays the municipal gaps calculated using expected expenditures. For comparison, figure 2 displays the municipal gaps calculated using actual expenditures. Results are largely consistent between the two; one primary difference is that tax capacity is larger for several southern Cook County municipalities in the analysis with actual expenditures. Perhaps one unsurprising result is that, in general, northern Cook County municipalities have greater tax capacity than more central and southern Cook County municipalities. However, there are “pockets” of municipalities with smaller tax capacity located within regions that have greater tax capacity, and vice versa.
Figure 1: Gap with Expected Expenditures

Figure 2: Gap with Actual Expenditures
In sum, identifying the ability for municipalities to absorb larger tax bills is becoming increasingly crucial to estimating local governments’ capacity to generate additional own-source revenues. Several methods exist that rely on comparisons between each government’s revenue and expenditures under hypothetical conditions. Here, we utilized the municipal-gap method to identify tax capacities for a subset of Cook County municipalities. Among the limitations of our analysis is the fact that we exclude important information on both the revenue and expenditure sides. Our analysis relies on non-school expenditures and property values to derive expected expenditures and revenue capacity. Local officials with more complete information on expenditures (e.g., for overlapping governments and schools) and revenues from additional sources (e.g., intergovernmental transfers) may benefit from estimating tax capacity using the municipal-gap approach, or one of the other methods we talked about in our previous blog.
Footnotes
1 FY2014 Annual Financial Report data procured from the financial database website.
2 U.S. Census Bureau; 2014 American Community Survey 5-Year Estimates, available online.


