Poor fiscal performance a problem for both state and local governments in Illinois
For a recent Chicago Fed Letter article, I looked back at the fiscal performance of Illinois’s state and local governments and found that, taken together, Illinois governments had been consistently spending more than they had brought in since at least the late 1980s. I also found that while the typical U.S. state often spent more than its revenues over this period, the extent of Illinois’s overspending (or under-taxing) was significantly greater. Finally, I found that the biggest difference in spending between Illinois and the typical state was that Illinois governments spent more on pensions.1
As I discussed in the article, in order to compare Illinois’s fiscal performance with other states’, I had to combine the data for state and local governments together. This was necessary because each state divides responsibilities for its activities differently between state and local governments (for example, some states fund K–12 schools primarily through state revenues, while others fund them primarily through local revenues).
That said, one question that naturally arises from my analysis is this: Was it Illinois’s state government, its local governments, or both that engaged in overspending (or under-taxing)? While it is not feasible to use the U.S. Census Bureau data I used for the Chicago Fed Letter to compare the performance of Illinois’s state or local governments with those of other states and their localities, it is possible to compare the performance of Illinois’s state government with that of its local governments.
There is one important caveat to the comparison that follows. During fiscal years (FY) 1988–2013, an average of 25.2% of local government revenues in Illinois came from the State of Illinois. This means that local governments in Illinois depend quite heavily on revenues from the state government to balance their books, and that some amount of overspending (or under-taxing) at the local level could be the result of unpredictable declines in revenues from the state government. However, at least for FY1988–2013, this does not appear to be the case, because the percentage of local revenues coming from the state was relatively stable (the standard deviation was 1.9 percentage points). Any overspending at the local level, then, was largely the result of locally made decisions.
Figure 1 plots expenditures as a share of revenues for the State of Illinois and for the sum of local governments in Illinois since FY1988.2 Over these years, local governments (summed together) have never spent less than they brought in. Perhaps surprisingly, the State of Illinois often performed better than local governments, though it did much worse in the years following the 2001 and 2008 recessions. The state spent less than it brought in in seven out of the 26 years the data cover—which is not a good performance, but better than the performance of local governments.
Figure 1. Expenditures as a share of revenues for Illinois governments

Sources: Author's calculations based on data from the U.S. Census Bureau and Illinois Department of Insurance.
Because the Census Bureau data lump all 6,963 local governments in Illinois3 together, it is impossible to know from the data which of these governments are responsible for the overall overspending (or under-taxing). Poor fiscal performance could be concentrated in a few large governments or be widespread. While it is well beyond the scope of this blog post to gather data on the overall fiscal performance of thousands of local governments, I am able to look at the performance of local governments’ pension systems, which is insightful because as I noted earlier, pension sp
ending was one of the biggest contributors to overspending (or under-taxing) by Illinois governments.
Perhaps the best summary measure of the condition of a pension system is its unfunded liability. This is the difference between the discounted present value of all the future payouts the pension has promised to make and the value of the pension’s assets. The unfunded liability, then, is the amount that taxpayers will have to contribute to the pension system in order for it to be able to cover all of its promised future payouts.
Table 1 shows a breakdown by locale of the total unfunded pension liability facing Illinois state and local governments at the end of FY2014.4 Of the $158.2 billion total, $104.6 billion (66%) was the responsibility of the state government and the remaining $53.6 billion (34%) was the responsibility of local governments. Beyond the state versus local government comparison, things get complicated because some pension systems cover overlapping geographies. The City of Chicago has six separate pension funds covering its workers, and there are three for Cook County employees (Cook County holds almost the entirety of Chicago and a number of its suburbs5). On top of that, most municipalities have their own police and firefighters pensions, and there is a single pension system for all other non-Chicago municipality workers called the Illinois Municipal Retirement Fund.
Even though the system of local government pensions in Illinois is somewhat complicated, it is clear from table 1 that the City of Chicago is disproportionally responsible for the accumulation of local unfunded pension liabilities. A little over one-fifth of Illinois’s population is in Chicago, but Chicago is responsible for more than half of local government unfunded pension liabilities in Illinois. Chicago residents owe $10,492 per person to their city’s pension systems, on top of the $8,130 per person they owe to the state pension systems.
Table 1. Unfunded pension liabilities in Illinois by locale
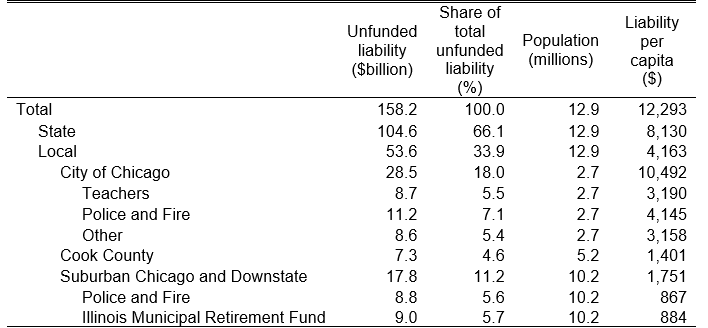
Sources: Author's calculations based on data from the Illinois Department of Insurance and U.S. Census Bureau.
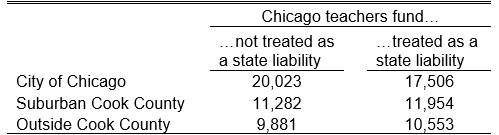
To make the comparison of the unfunded liabilities of Illinois’s local governments clearer, I show in table 2 the total per capita state and local unfunded liability by place of residence. There is one wrinkle acknowledged within the table, however, which is that Chicago residents are responsible for the pensions of all Illinois teachers, while Illinois residents outside of Chicago are not responsible for the pensions of Chicago teachers. Thus, perhaps a fairer comparison is to count the unfunded liability of the Chicago teachers’ pension fund as a state-level liability. While this change reduces the unfunded pension liability faced by Chicago residents by 13%, they still would owe a total of $17,506 per person to various Illinois pension systems. Those living outside Chicago would face a smaller, but still quite large, liability per person ($11,954 in suburban Cook County and $10,553 outside Cook County).
Table 2. Liability per capita, by place of residence
While suburban and downstate police and fire pension systems make up a relatively small part of the total unfunded pension liability of Illinois’s state and local governments (5.6%), pension systems for some municipalities may be in much worse shape than others, so that these liabilities can still matter quite a bit. Table 3 shows the unfunded liabilities for police and firefighters pensions for the 25 most populous cities in Illinois. Chicago is in the worst shape, but residents of Moline, Rock Island, Evanston, and Peoria all owe more than $2,000 per resident to their police and firefighters pension systems. Some cities are in much better shape. For example, residents of Urbana owe fewer than $500 per resident to their systems.
Table 3. Unfunded liabilities to police and fire fighters pensions
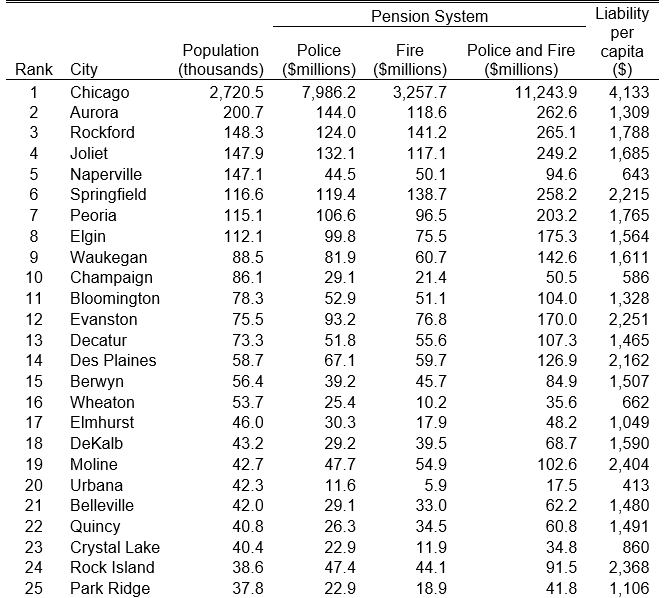
Sources: Author's calculations based on data from the Illinois Department of Insurance and U.S. Census Bureau.
This blog post shows that overspending (or under-taxing) has long been a problem for both the State of Illinois and the local governments in Illinois, with the accumulation of unfunded pension liabilities playing an important role at both levels of government. And while the City of Chicago has built up a larger unfunded pension liability than that of suburban Chicago and downstate Illinois, every region of Illinois bears some blame for overspending (or, once again, under-taxing).
Footnotes
1 See the Chicago Fed Letter for a detailed explanation of how I calculate pension spending.
2 See Chicago Fed Letter for details about how these figures are calculated. Expenditures include the change in pension liabilities.
3 2012 Census of Governments, available online.
4 All unfunded liability data come from the 2015 Biennial Report of the Illinois Department of Insurance Public Pension Division, available online.
5 Technically, a portion of O’Hare Airport—and therefore Chicago—is in DuPage County.


