2017 Mid-Year Review—A Solid First Half for the Seventh District, Thanks to Revivals in Global Growth and U.S. Oil Production
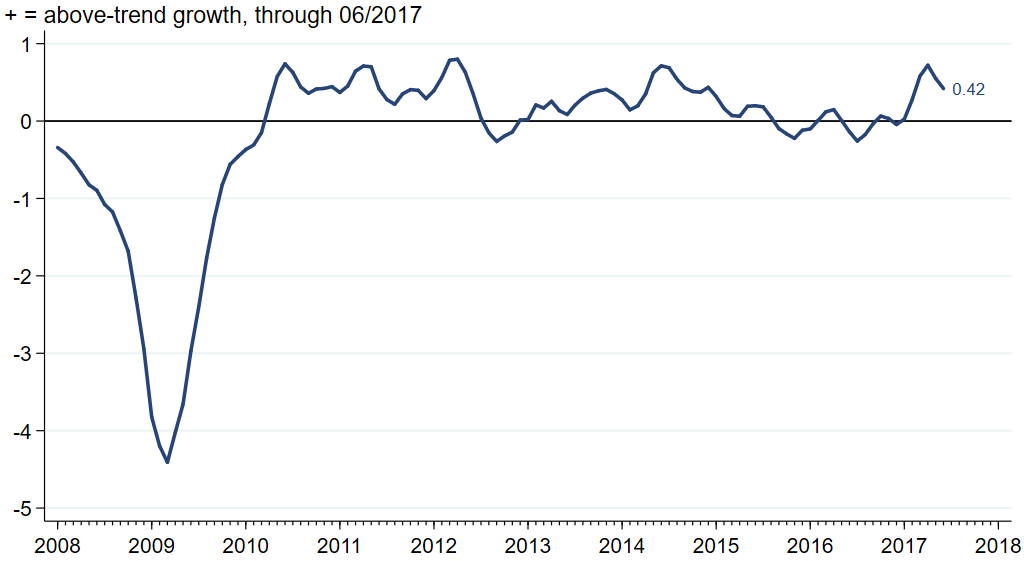
With the recent release of the Chicago Fed’s June Midwest Economy Index (MEI), we now have a good picture of how the Seventh District’s economy has done in the first half of this year. Overall, things went pretty well, and it appears that revivals in global growth and U.S. oil production are behind the good results. These revivals have lifted some long-struggling manufacturing industries in the District, including steel and heavy machinery. One cautionary note, though, is that the first half of the year has been disappointing for the auto industry, with signs that sales are slowing down to their long-run pace sooner than expected.The MEI is an index that summarizes over 100 state and regional economic indicators for the District, and it’s calibrated to be positive when economic growth in the District is above its long-run trend and negative when it’s below. Figure 1 shows that while growth in the Midwest was near trend for most of 2015 and 2016, it took off at the start of 2017. The index peaked in April of this year, when it enjoyed its highest reading in almost three years, and reflected one of the fastest growth rates since the end of the Great Recession.
1. Midwest Economy Index
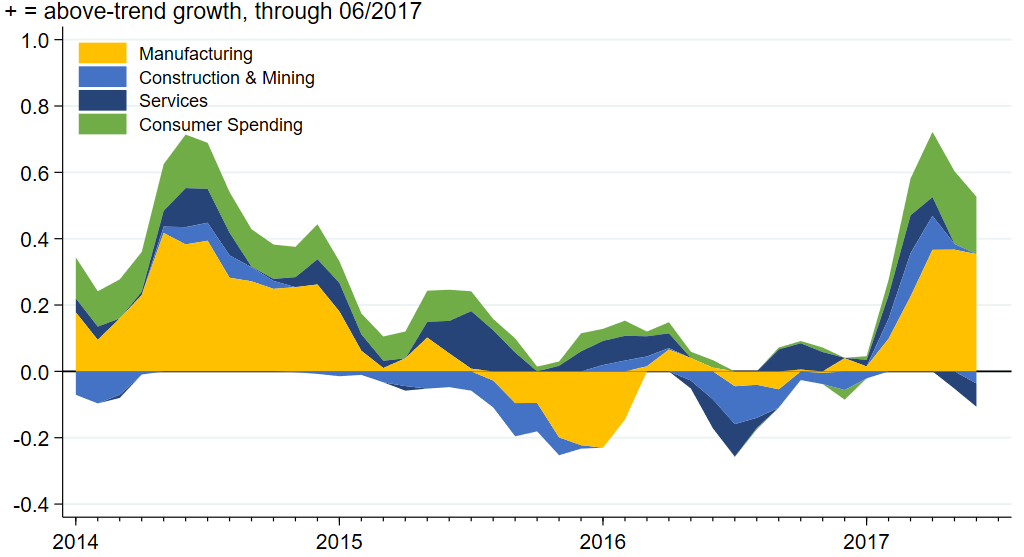
What’s behind the pickup in the MEI? To answer this question, let’s look first at the performance of the four broad sectors that make up the MEI. Manufacturing indicators typically drive changes in the index, and this time was no exception. Figure 2 shows that the manufacturing and consumer spending sectors have fared quite well so far in 2017, while the construction and mining and services sectors have stayed closer to their average growth rates.
2. Midwest Economy Index sectoral contributions
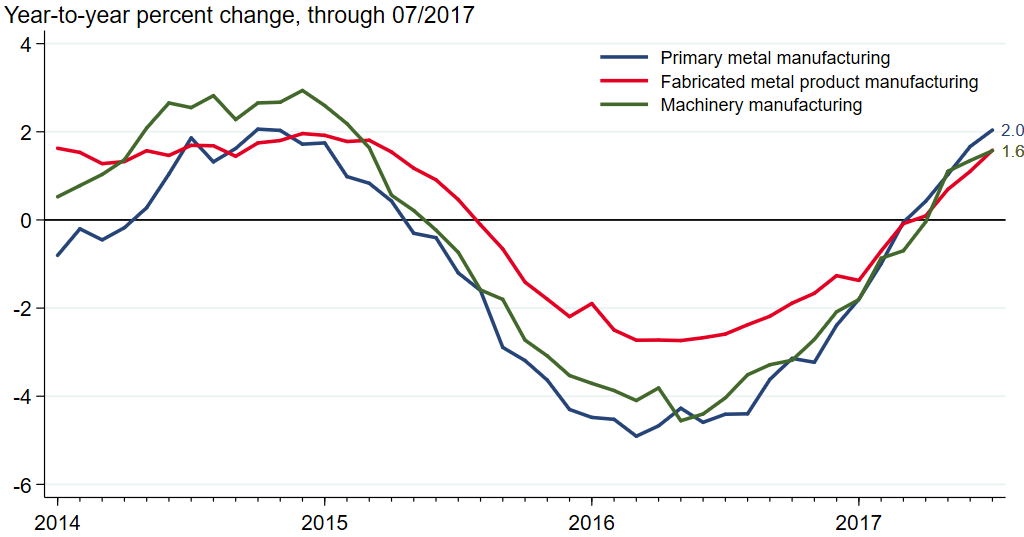
Much of the pickup in manufacturing can be attributed to a turnaround in fortunes of three industries that are important to the District: primary metals (particularly steel), fabricated metals, and heavy machinery. Figure 3 shows that the year-to-year growth rates of national employment in these industries were negative for most of 2015 and 2016, but that they have all returned to positive growth rates in 2017.
3. U.S. nonfarm payroll employment for selected industries
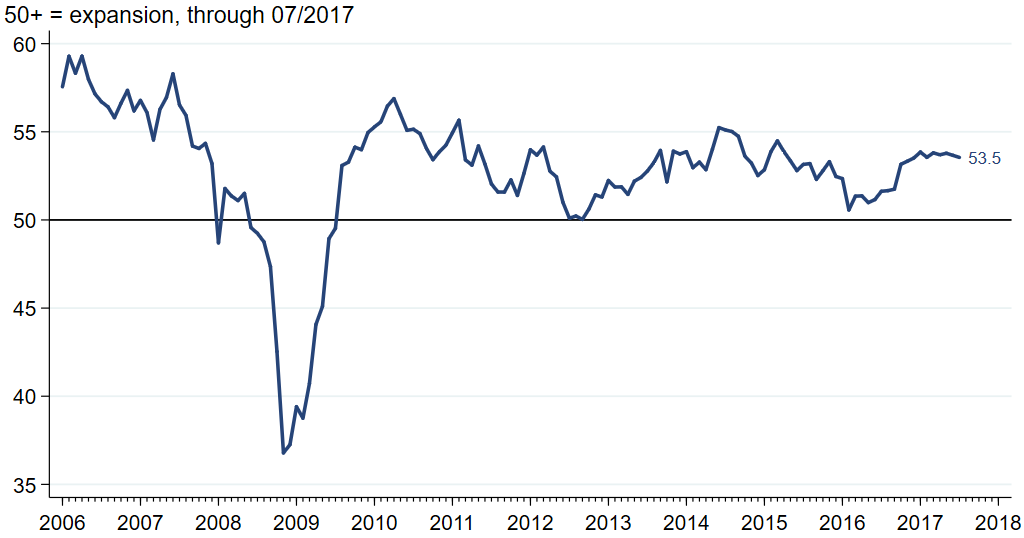
There appear to be two primary reasons for the return to growth. First, there is evidence that the state of the global economy has improved. One such piece of evidence is the JPMorgan Global Manufacturing and Services Purchasing Managers’ Index, which is constructed from a survey of over 18,000 purchasing managers in over 40 countries. Figure 4 shows that the index picked up in the middle of 2016 and has stayed solidly above 50—the value that separates expansions from contractions.
4. J.P. Morgan Global manufacturing & Services PMI
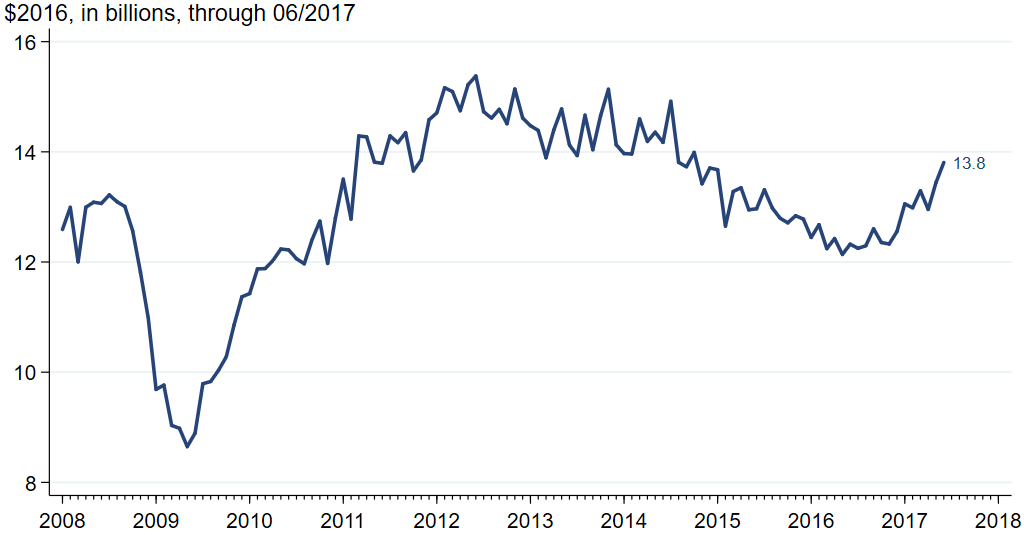
An improved global economy should lead to more exports for the District’s manufacturers and that is indeed what has happened. Figure 5 shows that, just like the global PMI, exports of manufactured goods from the District have been trending upward since the middle of 2016. And because the current value of exports remains below its mid-2012 peak ($15.4 billion), there is likely room for further improvement.
5. Seventh District exports of manufactured goods
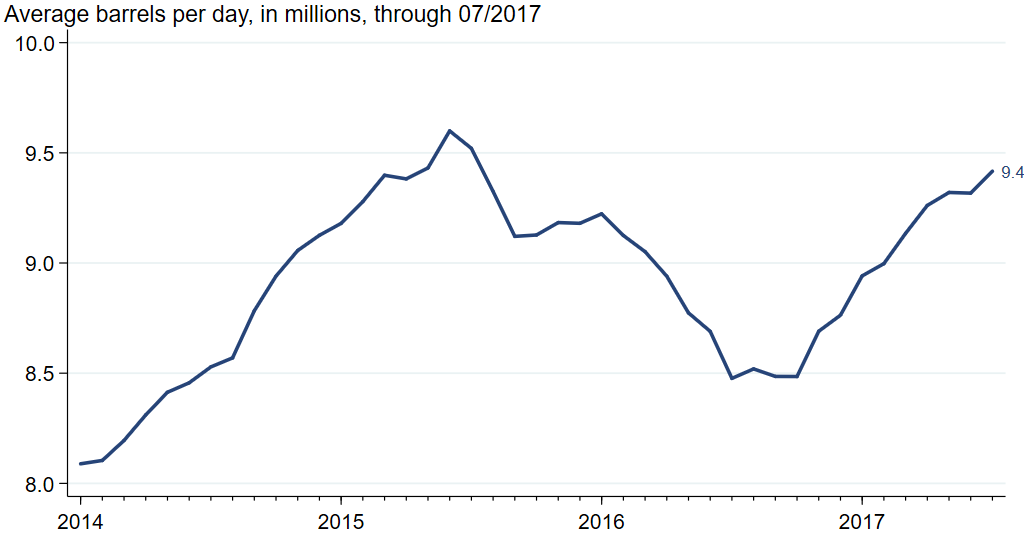
In addition to a better global economy, U.S. oil production has been on the rise, as shown in figure 6. It’s a bit strange to suggest that oil industry developments can matter to the Seventh District because so little production occurs here. However, it turns out that a number of the District’s important manufacturing industries supply oil producers (including those in sectors highlighted in figure 3). Here, too, it’s likely that oil production and demand for production supplies will continue to grow as fracking technology matures.
6. U.S. crude oil field production
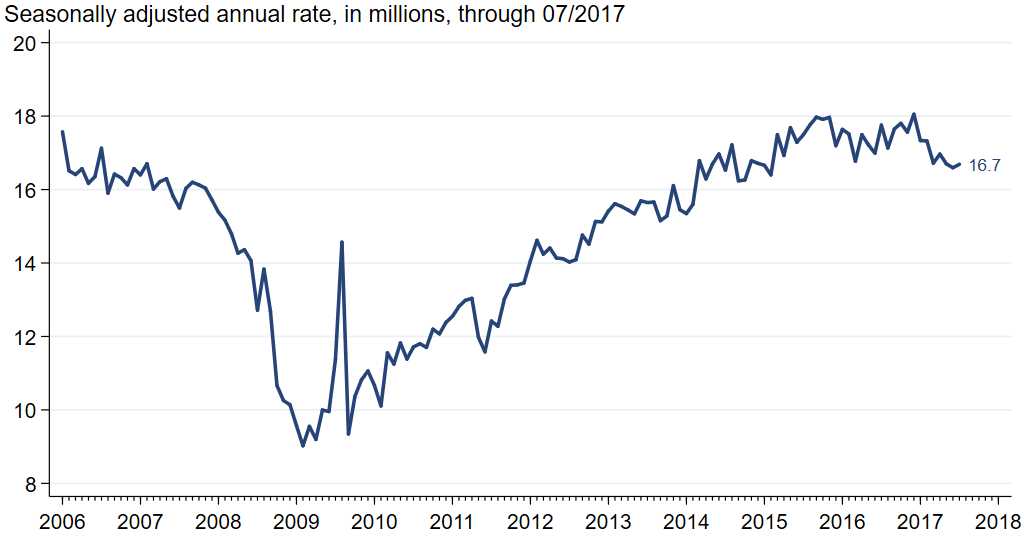
While there is largely good news to report about the Seventh District’s economy for the first half of the year, it is necessary to sound a note of caution for an industry that has been a star throughout the recovery from the Great Recession. The auto industry appears to be entering a lull. Figure 7 shows that auto sales have fallen from their 2015 and 2016 levels in the past few months. While industry forecasters have not thought that the 2015 and 2016 sales pace was sustainable, the slowdown may have come sooner than expected. Two months ago, at the Chicago Fed’s Auto Outlook Symposium, the consensus forecast of participants was for sales of 17.1 million units in 2017 and 16.9 million units in 2018, down from a record 17.5 million units in 2016. It is becoming more and more likely that their forecast for 2017 was too optimistic.
7. Light vehicle sales
As we look forward to the rest of this year, the question is, how long will above-trend growth in the Seventh District last? While the MEI is still quite positive, it has been moving downward through the second quarter of 2017. Given my analysis presented here, I would argue that the movement toward trend growth is likely to continue: While it appears that there is room for further stimulus from a stronger global economy and a recovery in U.S. oil production, these positive developments are likely to be offset by a slowdown in growth in the auto industry.


