Updated forecasts of Seventh District GSP growth
Updated forecasts of Seventh District GSP growth
Each year, the Chicago Fed provides estimates of annual gross state product (GSP) growth for the five states in the Seventh Federal Reserve District.1 While presenting last year’s projections, we proposed a new forecasting model incorporating the U.S. Bureau of Economic Analysis’s (BEA) quarterly GSP data. In this post, we again use our quarterly model to generate GSP growth forecasts for 2016 (whose actual values will become available next month) and compare our estimates to those produced by our previous (annual) model described in Brave and Wang.2
GSP growth and the MEI
The BEA releases annual GSP data for the prior year each May. However, in an effort to provide a more frequent reading on regional economic growth, the BEA has also been releasing preliminary quarterly estimates of GSP since 2014. While the lag time in the production of these estimates is not as substantial as it is for annual GSP, it can still be rather long. For example, through April 2017, the 2016:Q4 GSP data have not yet been released, and will not be released until May 11, 2017.
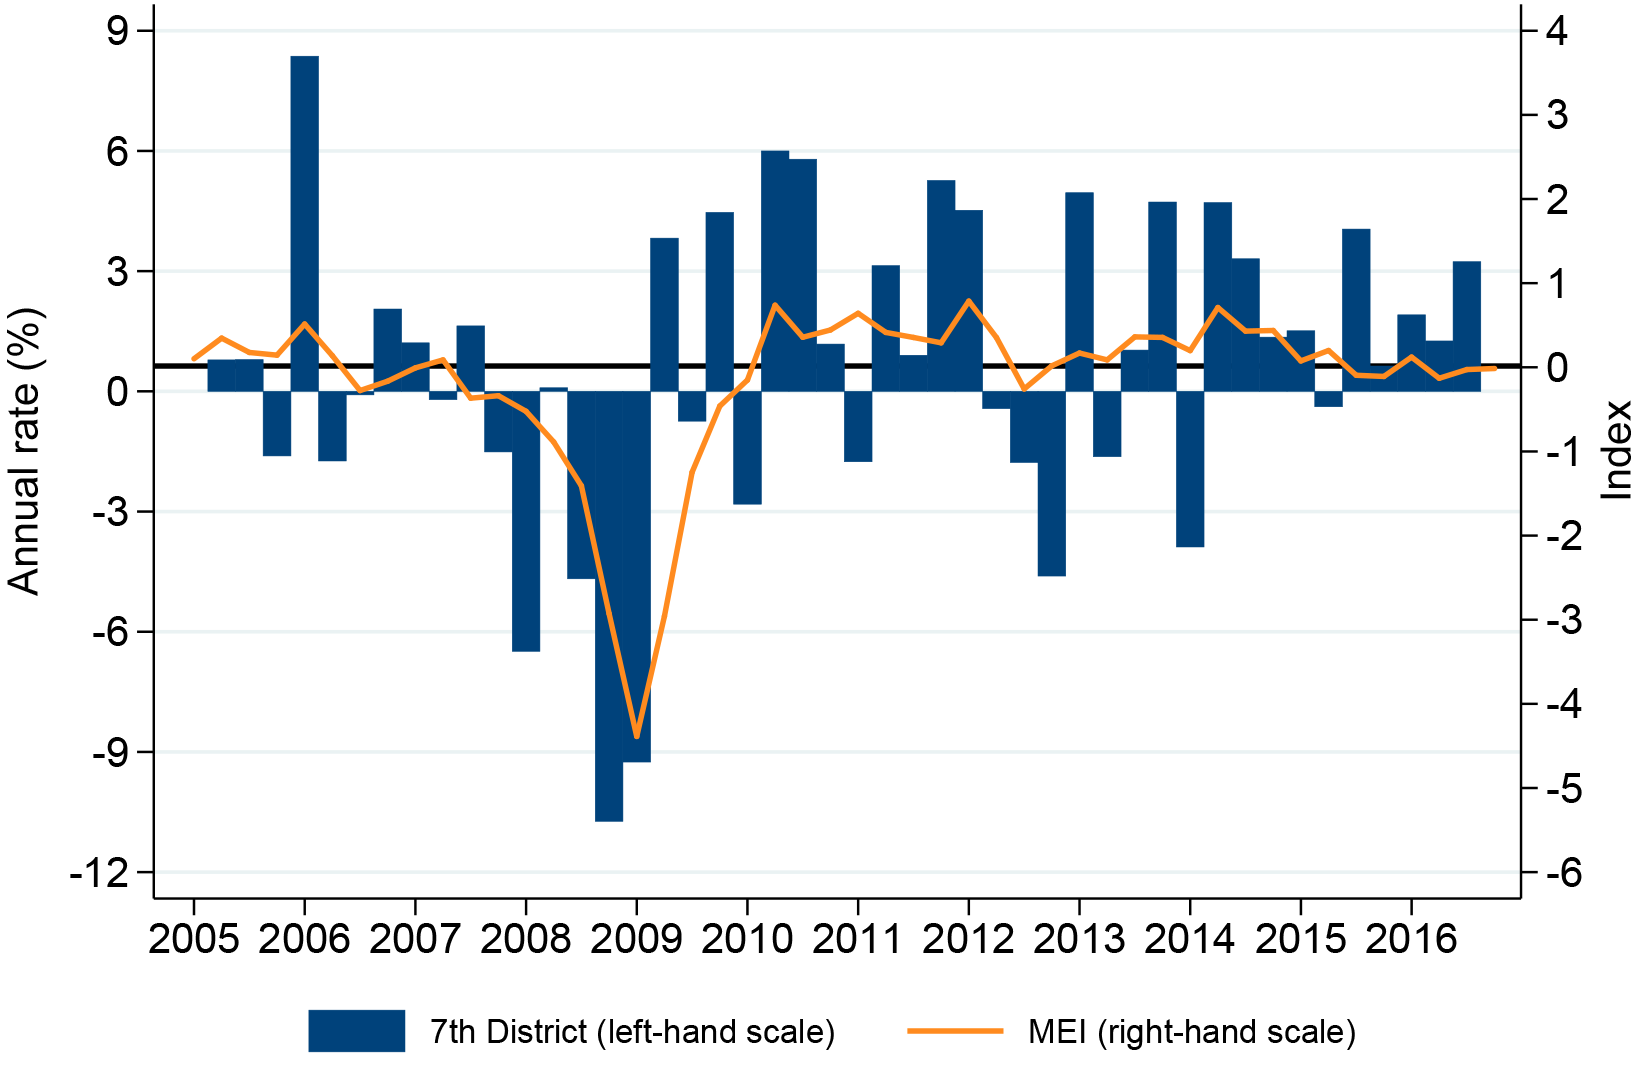
The Chicago Fed’s Midwest Economy Index (MEI) provides an even higher frequency reading on economic growth for the five states of the Seventh District.3 A weighted average of 129 state and regional indicators measuring growth in nonfarm business activity, the monthly MEI (like GSP) is a broad-based measure of economic conditions. After aggregating its monthly values to obtain a quarterly reading, the MEI also correlates quite well historically with Seventh District GSP growth.4 Figure 1 illustrates this relationship, featuring a sample correlation coefficient of 0.57. 5 For this reason, the MEI forms the basis of our forecasting model for Seventh District GSP growth described in the next section.
Figure 1. Seventh District GSP growth and the MEI
2016:Q4 projections
To project the 2016:Q4 annualized GSP growth rate for each of the Seventh District states, we use the following linear regression model:

This model relates each state’s current quarter GSP growth rate to national (the current quarter’s annualized growth rate of national gross domestic product, or GDP), regional (the current quarter’s MEI and relative MEI, or RMEI, index values), and state factors (the current quarter’s annualized growth rate of real personal income, or PI, and the previous quarter’s annualized GSP growth rate).
National and regional economic conditions play an important role in capturing state-level growth for all five Seventh District states. However, some states respond differently to regional economic conditions depending on the health of the national economy. The relative MEI reflects Midwest economic conditions relative to those of the nation, such that its inclusion in our model is designed to capture the interaction of national and regional factors on state-level growth. The inclusion of lagged GSP and state PI is then intended to capture state-specific factors that our regional and national indicators fail to. This is particularly important for states such as Iowa, where a larger share of economic activity is in agriculture, as the MEI only considers nonfarm business activity.
The extent to which each of these factors contributes to explaining GSP growth in our forecasting model varies across the five states. National growth seems to be the most important factor for Iowa, Illinois, and Wisconsin; but state and regional factors dominate for Indiana and Michigan, respectively.
Figure 2. 2016 GSP growth forecasts (quarterly)
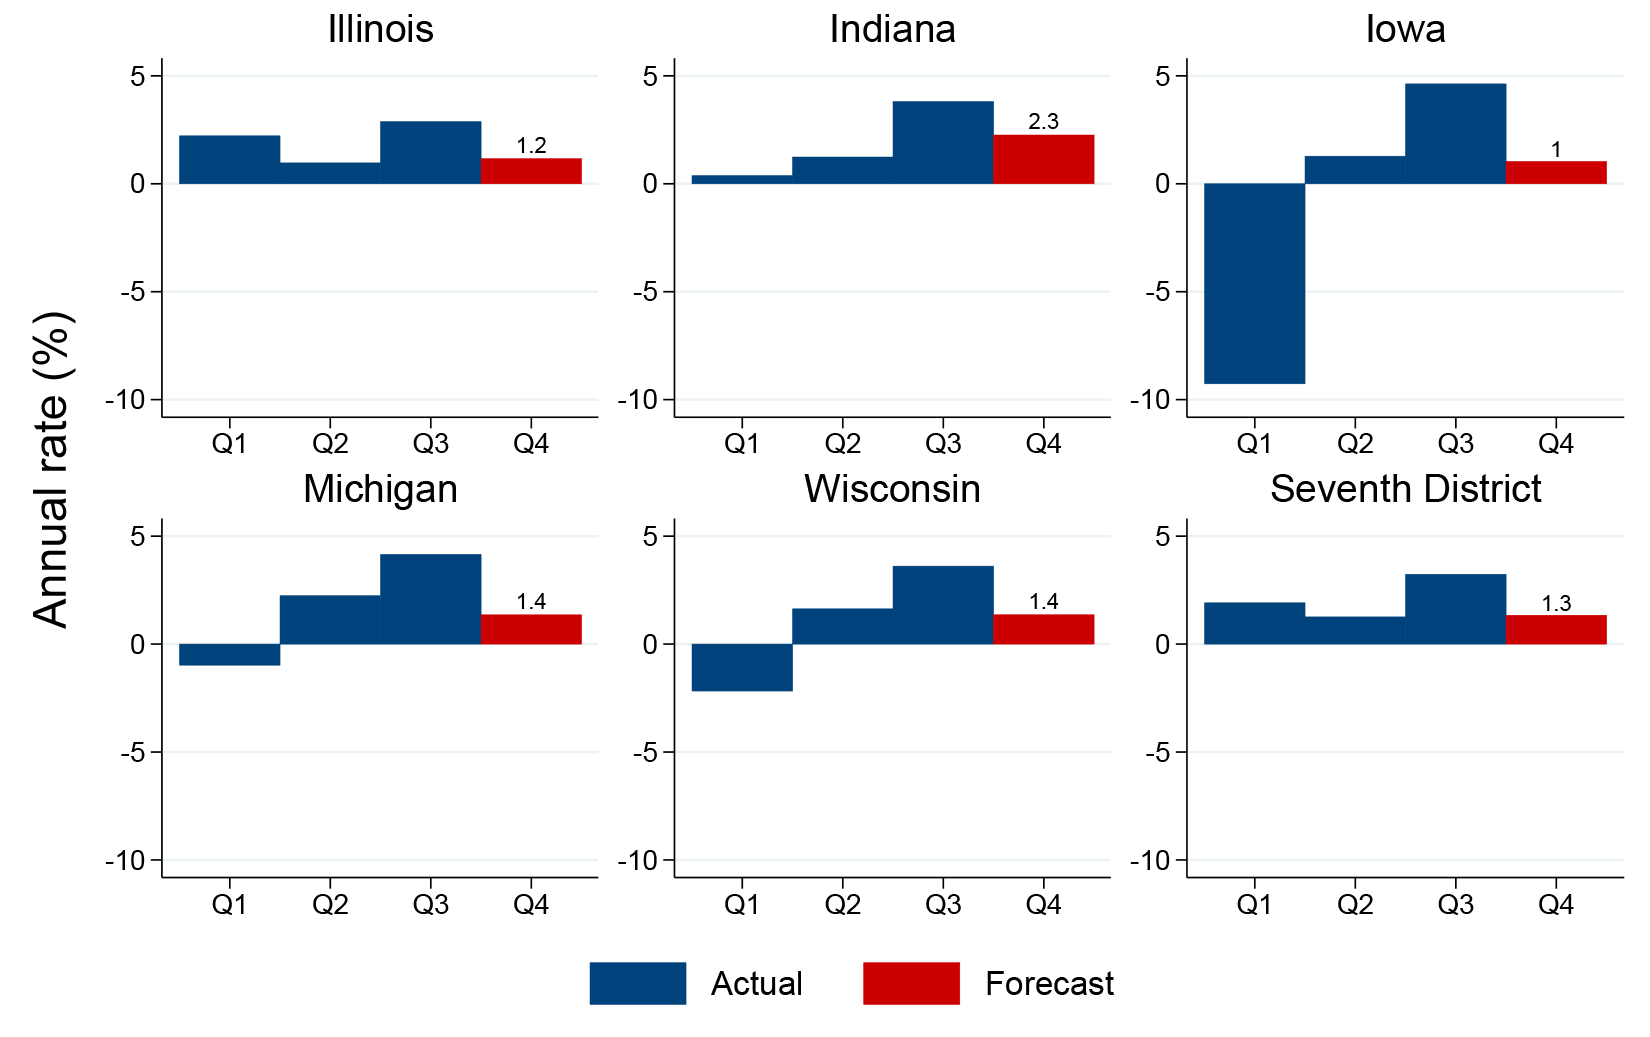
Figure 2 shows our projections for 2016:Q4 for the five Seventh District states and the Seventh District states combined.6 All five states featured fairly strong growth readings for 2016:Q3. As a result, the model predicts some mean reversion in Q4 for each state. Compared with the other four states, Iowa has a somewhat weaker GSP growth projection of 1.0%. This is explained in part by Iowa’s negative PI growth in Q4, whereas the other Seventh District states featured positive PI growth. On the other end of the spectrum, Indiana has a somewhat stronger projection of 2.3%.
2016 projections
Based on the quarterly GSP data for the first three quarters of 2016 and our projection for the fourth quarter, we can also project 2016 annual GSP growth for the Seventh District states. These estimates are shown in the first column of table 1. Our projection of 1.6% for annual GSP growth for the Seventh District states combined is identical to the national GDP growth rate. There is variation, however, in our annual forecasts across individual states, which can be largely explained by differences in observed growth in the first three quarters of the year (see figure 2). Michigan’s annual forecast is consistent with its strong growth readings in Q2 and Q3. Conversely, Iowa’s large negative growth rate in Q1 led to a negative annual growth rate forecast. Finally, Illinois’s and Indiana’s similar growth rates throughout the year yield similar annual forecasts; and Wisconsin’s weak first quarter weighs down its annual forecast despite relatively strong growth in Q2 and Q3.
Table 1. Annual GSP growth forecasts for 2016
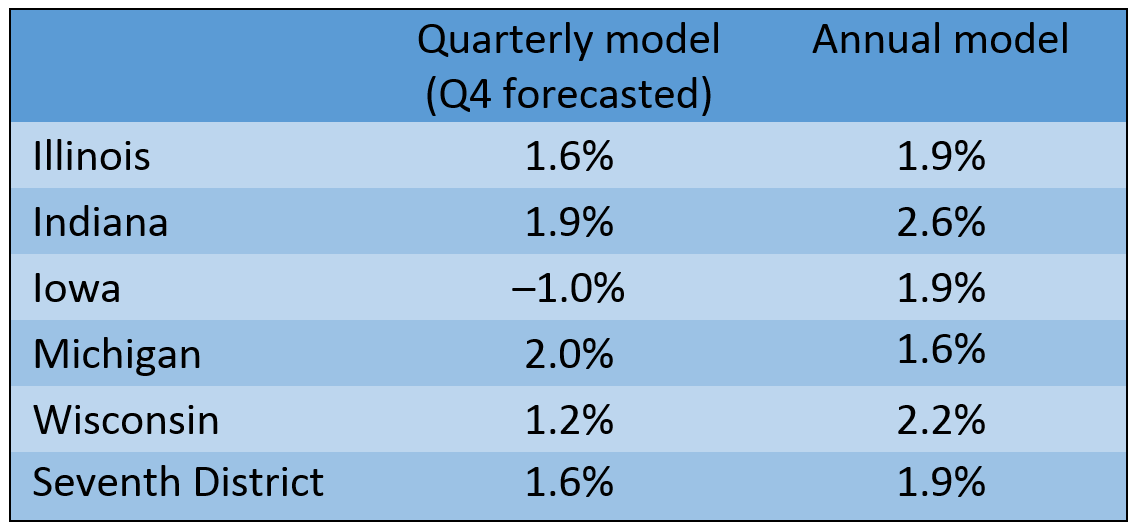
Soruce: Authors' calculations based on data from Haver Analytics.
We also present in the second column of table 1 projections from the annual GSP growth forecasting model described here. These projections are quite similar across the Seventh District states; but as we saw last year, the annual model tends to forecast higher growth than predicted by our quarterly model (the only exception being Michigan). In general, we believe the added information provided by considering GSP quarterly data should make our forecasts from the quarterly model more accurate than those from the annual model. However, some caution should be exercised while reviewing even these projections from the quarterly model. For instance, the readings shown in figure 2 may in fact be revised. At this time last year, Iowa had a similarly poor Q1 growth rate that was later revised up to a slightly positive value.
Conclusion
We will release our GSP growth forecasts for 2017:Q1 in June when state personal income data for the first quarter becomes available. These projections can be found in the MEI background slides.
Footnotes
1 The Seventh District comprises all of Iowa and most of Illinois, Indiana, Michigan, and Wisconsin. Further details are available online here and here.
2 Scott Brave and Norman Wang, 2011, “Predicting gross state product growth with the Chicago Fed’s Midwest Economy Index,” Chicago Fed Letter, Federal Reserve Bank of Chicago, No. 293, December, available online.
3 The entirety of the five states that are part of the Seventh District is considered for the MEI.
4 The MEI is constructed as a three-month moving average. Hence, to obtain the quarterly average values shown in figure 1, we use the MEI readings corresponding to the last month of each quarter.
5 We aggregate the five state values to one value for all Seventh District states using their nominal GSP shares. The horizontal solid black line in figure 1 corresponds to the average GSP growth rate over the sample period.
6 We arrive at the Seventh District forecasted value for 2016:Q4 by aggregating the state forecasts using nominal GSP shares from 2016:Q3.


