Updated Forecasts of Seventh District GSP Growth
Several years ago, the Chicago Fed began providing estimates of annual gross state product (GSP) growth for each of the five states in the Seventh Federal Reserve District.1 The U.S. Bureau of Economic Analysis (BEA) releases annual GSP data for the prior year each June. This post discusses GSP projections for 2015 and presents an alternative forecasting model using quarterly GSP data from the BEA.2
The 2015 Growth Picture
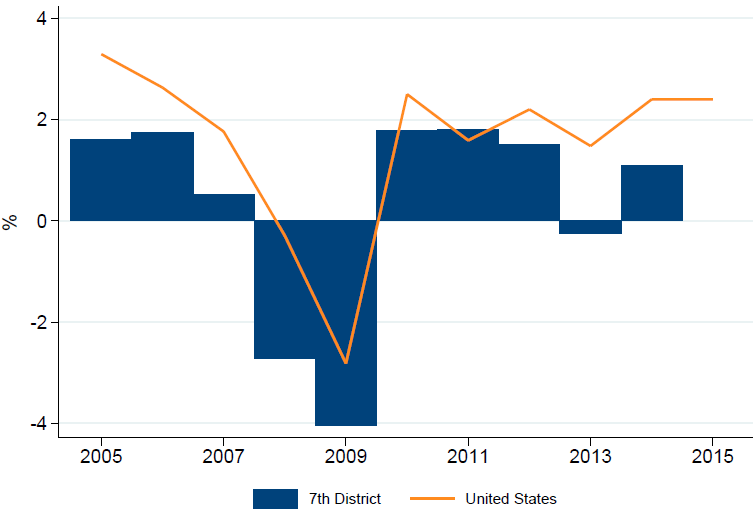
To provide context for our projections, we first take a brief look at the main indicators of our model. Figure 1 shows annual U.S. gross domestic product (GDP) growth and GSP growth aggregated across the five states in the Seventh District from 2005 through 2014. Actual GSP data for 2015 will not be released for another month. However, we can get a sense of what this data is likely to show by comparing the recent histories in the figure. While growth in the Seventh District has lagged behind the nation in recent years, it has tended to follow a similar trend over longer periods. The U.S. maintained an annual growth rate of around 2.4% from 2014 to 2015, providing a reasonable starting point for our estimate of District growth in 2015.
Figure 1. U.S. vs. Seventh District GDP growth
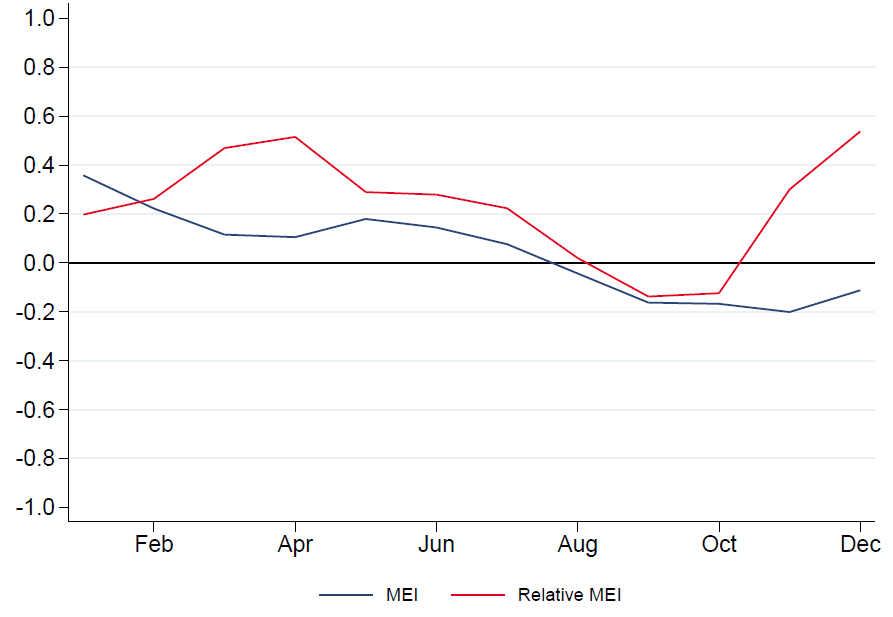
The Chicago Fed’s Midwest Economy Index (MEI) then provides a useful link between national and regional growth that can give us a sense of the likely persistence of the recent shortfall between District and national growth. As figure 2 shows, the MEI indicated that the Midwest economy experienced growth that was somewhat above trend in the first half of 2015 and slightly below trend in the second half. Additionally, the relative MEI dipped below zero in the third quarter, suggesting that Midwest economic growth was further below its trend than national growth was in the second half of the year. Though the MEI does not explicitly pertain to GSP growth, historically a zero value for the index has been roughly consistent with 1.5% annual GSP growth for the District. In light of this, both the MEI and relative MEI suggest that District GSP growth in 2015 likely rebounded from its 2014 rate of 1.1% to somewhat above its trend rate of 1.5%, but still below the national growth rate of 2.4%.
Figure 2. MEI and relative MEI in 2015
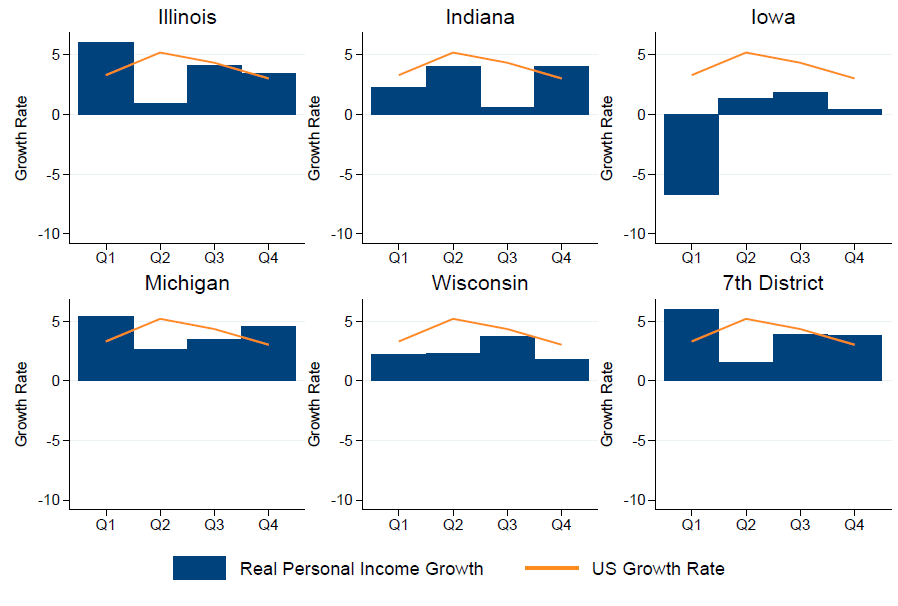
Finally, we turn to annualized quarterly growth of state real personal income over 2015—which provides an indication of how state-specific factors may have affected District GSP growth in 2015. Figure 3 shows that both Illinois and Michigan experienced strong income growth in the first quarter of 2015. Though the District states generally experienced weak income growth in the second quarter in comparison with the national average, growth rates in the remaining quarters of 2015 were of similar magnitudes to the national rate. Taken together, these data suggest some likely variation in GSP growth rates across the District states, but for the most part, they are consistent with the MEI and U.S. GDP growth data in figures 1 and 2.
Figure 3. 2015 real personal income growth
Forecasts for 2015
Our forecasts for 2015 combine the information in the indicators discussed in the previous section to arrive at an estimate of annual GSP growth for the District states and the District as a whole. Since 2011, the Chicago Fed has used the following statistical model to estimate annual GSP growth:

This model explains the annual GSP growth rate of each Seventh District state as a function of national GDP growth, regional economic conditions as captured by the monthly MEI and relative MEI, and state-specific conditions (specifically, quarterly real personal income growth and annual GSP growth in the previous year).3 We aggregate state projections into a District-wide forecast using each state’s respective share of nominal District GSP.
Figure 4 shows for each District state and the entire District their respective historical GSP growth (blue bars), in-sample fits (orange lines) of GSP growth obtained from our statistical model, and 2015 out-of-sample projections (green lines). With the exception of Iowa, the model predicts an increase in the GSP growth rate for the Seventh District states, as well as the District as a whole. Interestingly, this seems out of line with the national GDP data and the MEI and relative MEI data discussed earlier. It is of note, however, that for 2014 the model also estimated higher GSP growth than what was realized for each state.
Figure 4. Seventh District growth forecasts (annual)
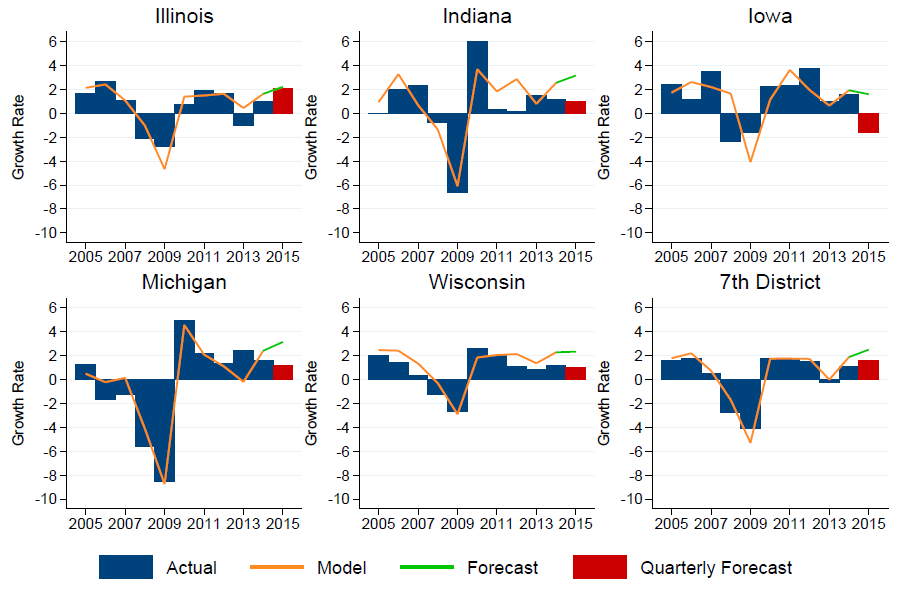
Motivated by our model’s recent shortcomings, we developed a similar model estimated using the experimental quarterly GSP data recently published by the BEA. Figure 4 also contains projections of annual GSP growth (red bars) obtained from this new model. At the time of writing, these data were available through the third quarter of 2015. To obtain a GSP growth projection for all of 2015 with these data, we need only estimate the fourth quarter’s value. Using the new statistical model to obtain this estimate and combining it with the data from the first three quarters, we arrive at an alternative forecast for 2015.
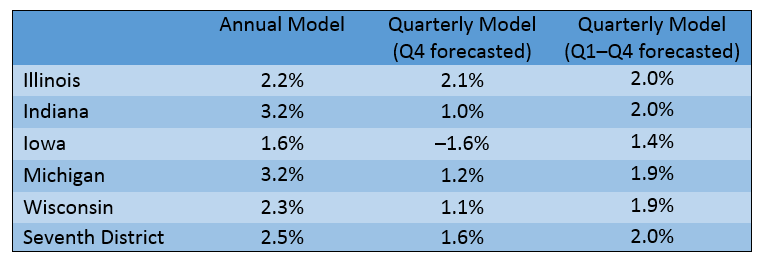
Figure 4 clearly shows a large difference between our two forecasting models. As table 1 further demonstrates, the projections from our new quarterly model (Q4 forecasted column) are below those of our original annual model in every instance, and often by quite large magnitudes. For the District as a whole, our quarterly model predicts more modest GSP growth of 1.6%, compared with 2.5% as forecasted by the annual model. This estimate from our quarterly model is also in line with the previous evidence suggesting growth was slightly above the historical trend of 1.5% but below the national growth rate of 2.4% for 2015.
Table 1. Annual GSP Growth Forecasts for 20154
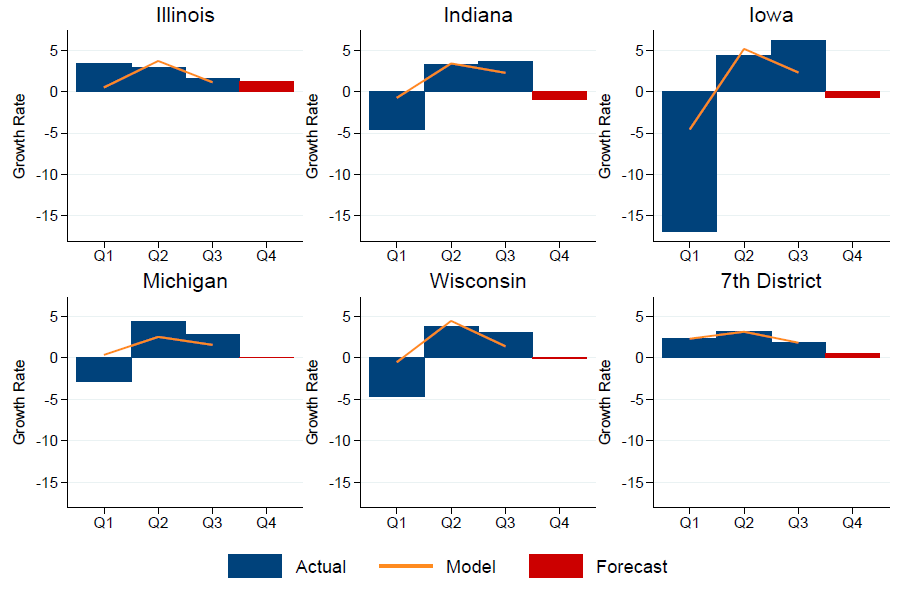
To illustrate the sources of the discrepancy between our model forecasts, we plot in figure 5 the annualized quarterly GSP growth data from the BEA (blue bars) for 2015, including our fourth quarter estimates (red bars) and fitted values from the model (orange lines). It is important to note that both our annual and quarterly models use the same 2015 data for the variables that they share in common, with the exception of the three quarters of GSP data that we have for 2015. These data show sharp contractions in GSP for every District state (with the exception of Illinois) in the first quarter. More than anything else, this feature of the quarterly data is the dominant source of the discrepancies between our annual and quarterly model projections. The model fits in figure 5 make this clear, as they demonstrate very large negative residuals in the first quarter and only small misses in the other quarters, reflecting the fact that the declines in GSP in the first quarter are not consistent with the indicators in our statistical model.
Figure 5. 2015 GSP growth forecasts
It is possible that the quarterly GSP data for 2015 will be revised upon the release of the annual figure next month. As noted previously, our model predicts weak first quarters for the District states, but not nearly as dramatically as what has been released by the BEA thus far. Considering the apparent inconsistency between the quarterly data and the model, we also generate a forecast for 2015 that uses the fitted values for the first three quarters of 2015 GSP growth instead of the quarterly data. These projections, presented in the Q1–Q4 forecasted column of table 1, are larger than the quarterly model’s estimates using the quarterly values for 2015, but are still below those of the annual model. Moreover, these projections suggest that at 2.0%, District GSP growth improved in 2015 and was closer to the national average, but still below it.
Conclusion
We will continue to monitor the performance of both our annual and quarterly forecasting models. However, based on the results presented here, we intend to report annual GSP growth rates for each District state from our new quarterly model combined with the available quarterly data for the 2015 forecast (as presented in the Q4 forecasted column in table 1). From now on, we will continue to report estimates from this model as long as the quarterly data from the BEA make it possible to do so.
Footnotes
1 The Seventh District comprises parts of Illinois, Indiana, Michigan and Wisconsin, as well as all of Iowa.
2 The quarterly GSP data provided by the BEA is still in an experimental phase. For more information, visit this link.
3 The model is explained in more detail in Brave and Wang (2012).
4 To allow for “like-for-like” comparisons among District forecasts, we aggregate state-specific annual forecasts to the District level using annual nominal GSP shares. The 2015 projections were aggregated using the 2014 shares.


