Third Quarter (Plus October) Review—Seventh District Still Doing Well, but Growth Has Slowed Some
Summary
Seventh Federal Reserve District growth has slowed some relative to earlier in the year. That said, the data largely indicate that the District’s economy is still growing at a healthy pace. The manufacturing sector is doing quite well, with most of its subsectors contributing to the sector’s high growth rate. Outside of manufacturing, most sectors continue to experience steady growth. Positive outlooks for U.S. and, to a lesser extent, global growth suggest that the District’s economy will continue to do well in the near term.
Now let’s look at the economic indicators that support this analysis.
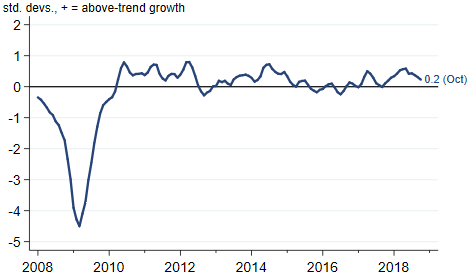
The Midwest Economy Index (MEI), which summarizes more than 100 state and regional economic indicators for the Seventh District states, shows that the pace of growth has been above trend for all of 2018 (figure 1). The index started trending downward in June, but is still comfortably in positive territory.
1. Midwest Economy Index
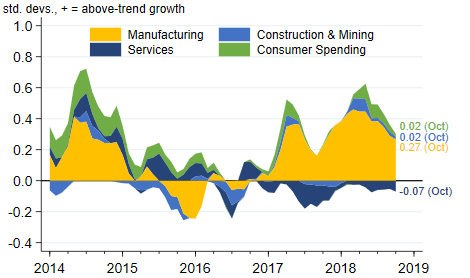
If we look at the contributions from the sectors that make up the MEI (figure 2), we can see that the success of the manufacturing sector almost entirely explains why the MEI has been above trend. Contributions from the remaining three sectors are all at about their respective long-term growth rates.
2. MEI sectoral contributions
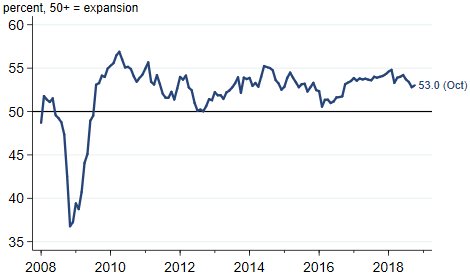
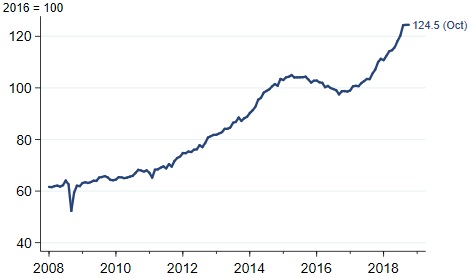
Why has manufacturing done so well? As I’ve been noting for a while now, solid growth in the U.S. and across the world, combined with rising output from the U.S. oil and gas industry, has led to increasing demand for the District’s manufactured goods. Recently, though, global growth appears to have slowed some. In addition, U.S. oil and gas production has taken a pause in response to falling oil prices. The J. P. Morgan Global Manufacturing & Services PMI (purchasing managers’ index) indicates that, like the MEI, the pace of global growth likely peaked in June (figure 3). Meanwhile, U.S. oil and gas production has been flat since August, after trending strongly upward for a year and a half (figure 4).
3. J.P. Morgan global manufacturing & services PMI
4. Industrial production index of oil and gas extraction
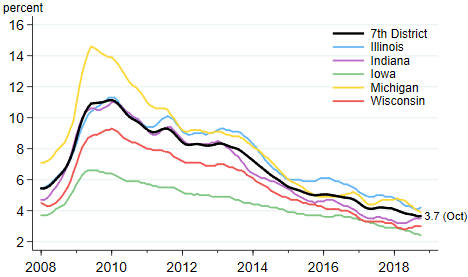
While the Seventh District’s growth seems to have slowed some, overall economic conditions are still quite good, so it is no surprise that the labor market is also in good shape. Unemployment rates are low across all five District states (figure 5), and the District’s overall rate is the lowest it’s been since 2000. Moreover, after years of disappointing numbers following the Great Recession, it appears that wage growth is picking up in the Seventh District and the U.S. as a whole (figure 6). Compared with a year ago, the 12-month moving average of average hourly wages is 3.2 percent higher for Seventh District states and 2.7 percent higher for the nation. This measure of Seventh District states’ wage growth is the highest it’s been since the U.S. Bureau of Labor Statistics started producing it in 2008.
5. Unemployment rates for Seventh District states
6. Average hourly earnings growth

Note: Growth in average hourly earnings is calculated as the 12-month percent change in the series's 12-month moving average.
Conclusion
The Seventh District’s pace of economic growth has slowed some, but the second half of 2018 has still been good a one thus far. Most signs point to the good times continuing at least into the near future, though the possibility a further slowdown poses some longer term risk.


