Climate Change and Risks to Midwest Agriculture
Though the weather changes frequently in the middle part of the U.S., adverse climate-related changes represent a serious risk to Midwest agriculture and could impair the region’s financial health, especially given the farm sector’s importance in this region. Furthermore, the health of agriculture remains vital to the banking system of the region, with nearly 30% of U.S. agricultural banks1 headquartered in the Seventh District of the Federal Reserve System.2 As a regulator of banks, the Federal Reserve Bank of Chicago has a keen interest in the performance of the banking sector and risks it may face, such as those generated by climate change that will impact agriculture. In addition, the Federal Reserve System has responsibility for monetary policy, which requires understanding risks to the economy and its future growth. Inasmuch as climate change has the potential to limit growth of the economy through effects on sectors, such as agriculture, the Chicago Fed seeks to understand these risks, especially for the Midwest and its capacity to produce economic output.
Higher temperatures and greater variability during the critical growing period for corn and soybeans could lead to lower levels of production than would otherwise be achieved. An acute, albeit likely slow, change in crop production poses a significant risk, especially presuming that demand for these crops continues to rise as a result of worldwide population growth and the importance of the Midwest as a major contributor to feeding the world. Farming and ranching in the Midwest involve significant risks in the best of times, let alone under climate change. Moreover, the effects of climate change will not be uniform over the region, as spatial variation and product diversity are important factors.
Agriculture’s role in the Midwest economy
The American Midwest3 spans a large group of states, the core of which is in the Seventh District. Agriculture is a primary driver of economic activity in many rural areas of the Midwest. As seen in figure 1, counties throughout the Midwest are dependent on agriculture, as defined by the Economic Research Service (ERS) of the U.S. Department of Agriculture (USDA) based on cutoffs of 25% for income or 16% of employment from farming. Many rural midwestern counties that didn’t meet these USDA criteria also have substantial agricultural economic activity.
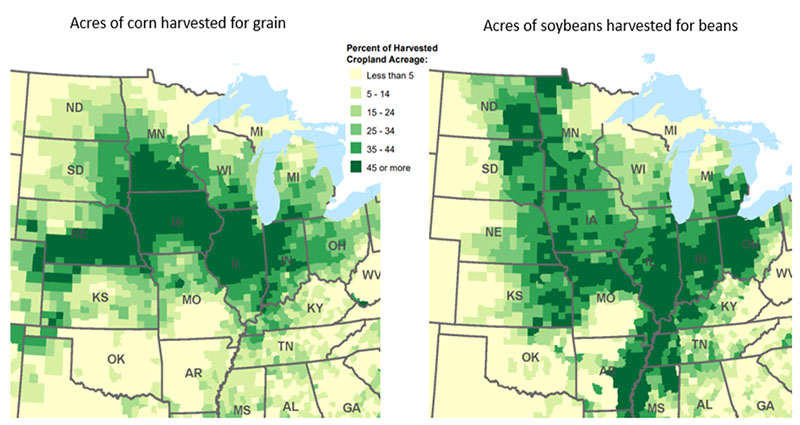
The agricultural sector of the Midwest produces a sizable percentage of total U.S. agricultural output in any given year. In 2020, farms and ranches in midwestern states were responsible for 27% of U.S. agricultural output.4 In 2021, the region’s percentage of national output was much higher for a number of key agricultural products: 61.2% of corn for grain, 62.3% of soybeans,5 67.6% of hogs and pigs,6 32.1% of milk,7 and 41.6% of chickens (except for broilers).8 The Corn Belt stretches across the Midwest, and while soybean production centers on the Midwest, soybeans are increasingly being planted farther to the south and north as well (see figure 2).
1. Farming-dependent counties, 2015 edition
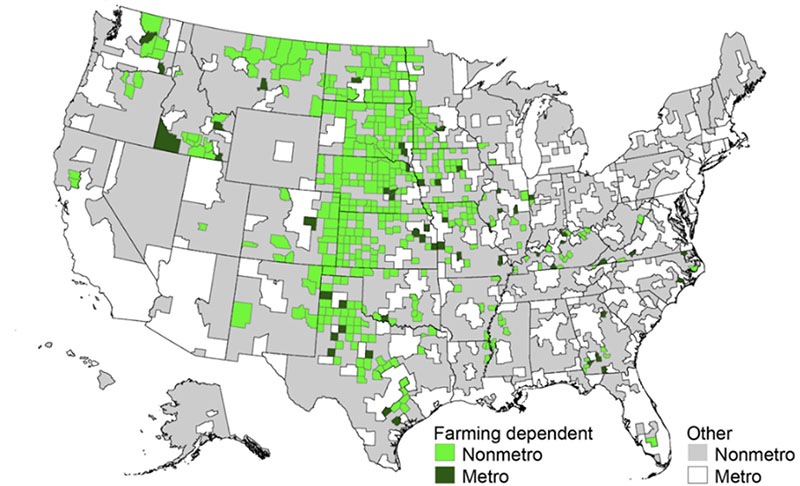
Source: United States Department of Agriculture, Economic Research Service, using data from U.S. Bureau of Economic Analysis.
2. Primary U.S. counties for corn and soybean production (selected states)
Likely negative climate impacts
Climate change could impact Midwest agriculture in several ways, including intense heat waves, more frequent droughts, more damaging storms, wider flooding, deadlier disease outbreaks, and the spread of invasive species. Scientists predict that temperature and precipitation extremes will likely become wider in the coming decades. Higher temperatures (see figure 3) and more variable precipitation (see figure 4) could have major negative effects on Midwest farm output.
3. Observed and projected change in annual average temperature
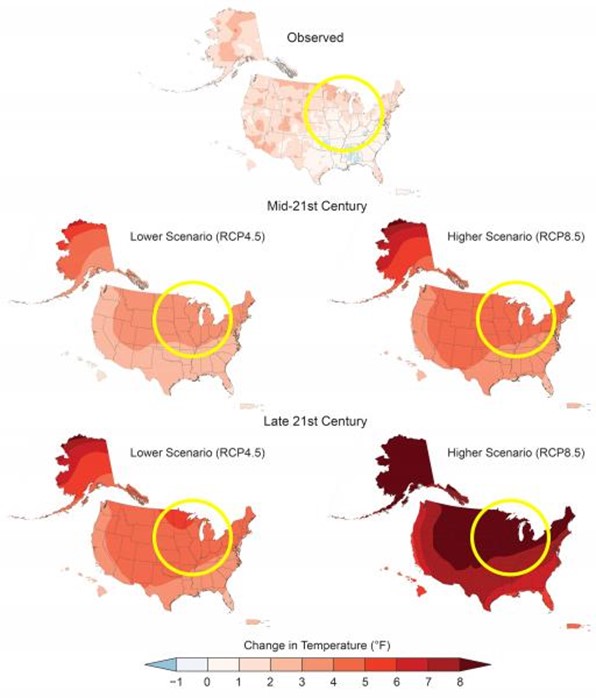
Sources: Our Changing Climate - Fourth National Climate Assessment (globalchange.gov) and Observed and Projected Changes in Annual Average Temperature | U.S. Climate Resilience Toolkit.
4. Observed and projected change in seasonal precipitation
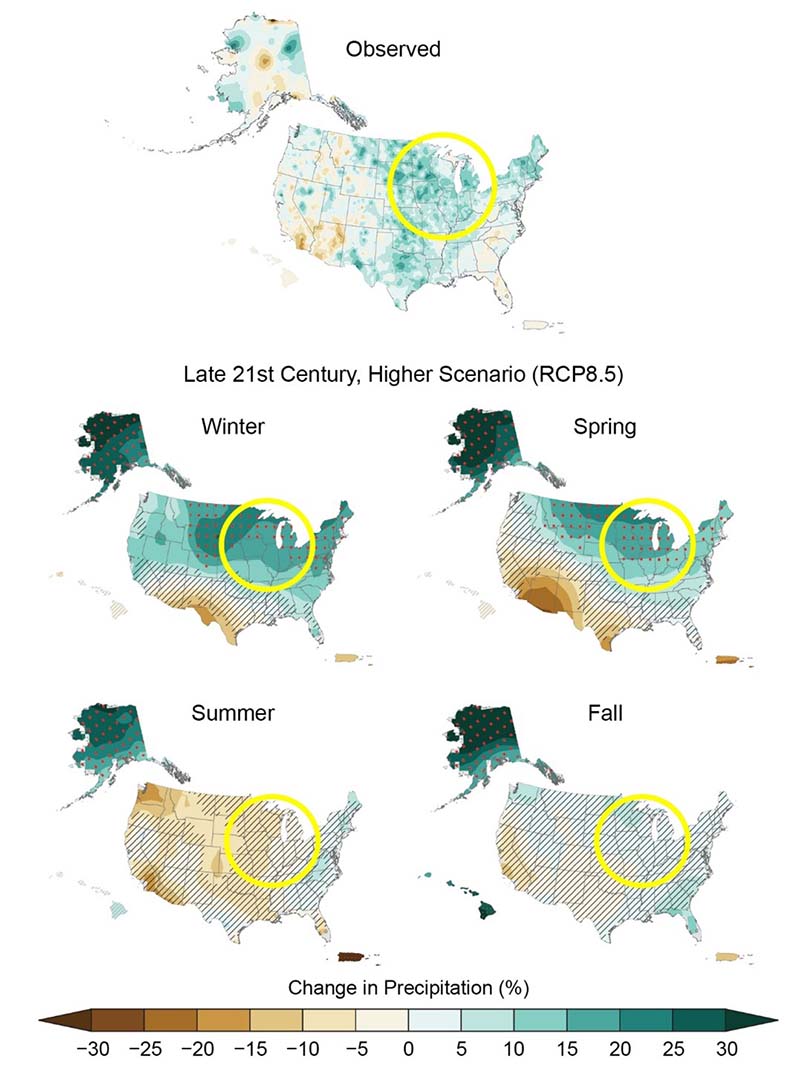
Sources: Our Changing Climate - Fourth National Climate Assessment (globalchange.gov) and Observed and Projected Changes in Annual Average Temperature | U.S. Climate Resilience Toolkit.
Heat waves
The intensity and coverage of heat waves has become of greater concern for the production of food in the Northern Hemisphere (Rogers et al., 2022). Damage from heat waves could involve losses of both crops and livestock, especially at key times and for vulnerable creatures. Combined with drought, heat waves could become extremely problematic for farms and ranches in the Midwest.
Droughts
Scientists expect climatic changes will lead to increased risk of drought in parts of the Midwest, even as other regions may see higher levels of precipitation through the mid-twenty-first century (see figure 4). Any specific drought impacts local areas in quite different ways, depending on the initial levels of soil moisture and the severity of the event. In addition, irrigation may offer a means for farms to combat losses from drought, given the necessary water resources, infrastructure, and access to funding.
Storms and floods
Besides heat waves and droughts, damaging storms could afflict the Midwest more often under climate change. Very high winds and excessive rains can damage crops, potentially through wider flooding. For instance, in August 2020, a derecho swept through much of the Corn Belt. Pegged as the costliest thunderstorm in the history of the U.S., the National Oceanic and Atmospheric Administration estimated that winds greater than 100 mph flattened millions of acres of crops and damaged farm structures, causing at least $11 billion of damage in the Midwest. Most of this damage was covered by insurance policies for hazards. Even so, expanded risks from climate change could bring upheaval to insurance markets and potentially lead to financial losses for agricultural operations.
Disease outbreaks and invasive species
Research suggests climate change may also lead to more frequent major outbreaks of diseases, threatening Midwest agriculture. Disease pressures on crops could grow, potentially limiting yields and shaving farm incomes. Livestock producers could face greater problems with diseases, in addition to other climate-related issues. As an example of the possible severity of these outbreaks, in 2022, around 58 million birds under management at over 300 commercial operations were infected with a deadly and highly contagious avian influenza, leading to their destruction in order to slow the spread of the disease. With nearly 27% of the infected birds in Iowa, the Midwest was at the epicenter of this outbreak. Avian influenza outbreaks are just one of the disease risks facing the livestock sector.
In addition, as temperatures rise and precipitation patterns change, the advance of invasive species is likely to accelerate and pose a major risk to Midwest agriculture. Scientists expect warmer winters to lead to greater numbers of insect pests, plus the northward migration of crop pests and pathogens.
Financial position of farm operations
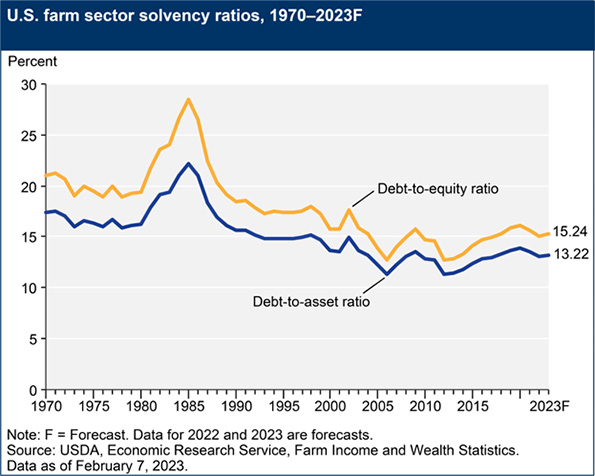
Climate-related problems could threaten the financial health of Midwest agriculture, as risks increase for farms and ranches and expected returns decrease. Moreover, lending to agriculture would involve greater risks as well. After two years of improvement in farm sector debt, the USDA forecasted that debt burdens would deteriorate in 2023—albeit well below ratios noted in the 1980s farm crisis (see figure 5a). It is acknowledged that these metrics include the entire farm sector (row crops, livestock, and specialty crops), as well as those operations that do not borrow. However, this does provide a useful gauge to identify the overall level of debt relative to measures of the resources available to farm operations.
5. Farm sector solvency ratios and debt
A.
B.
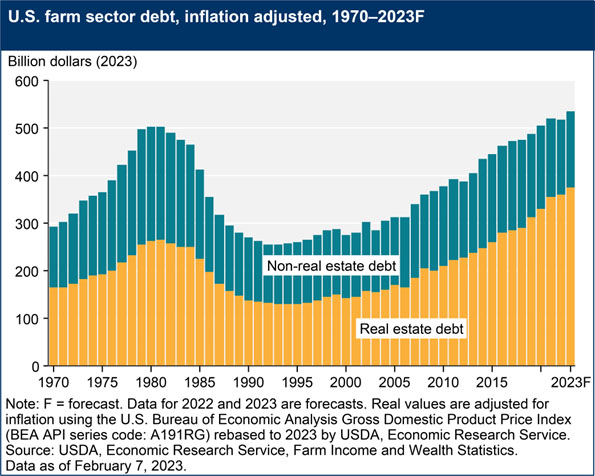
According to the USDA forecast, farming debt will reach a record in 2023, even after adjusting for inflation (see figure 5b). The USDA also breaks out farm sector debt between real estate and non-real-estate loans. With nearly 70% backed by real estate in 2022, agricultural land and structures have an outsized role in the safety of farm debt. In addition, farm real estate assets (land and its attachments) comprised 83% of total farm assets in 2022. As a result, the value of farmland has a tremendous impact on the solvency of most agricultural operations.
As a primary agricultural asset, farmland has a special role in the financial implications of climate change on Midwest agriculture. Although the effects of climate change on farmland values are uncertain, we can explore further using an asset pricing model. The present value model, as formalized by Campbell and Shiller (1987), relates an asset’s real price at a point in time with the discounted stream of expected returns that will be generated by the asset for its owner in the future. Discounting in this context usually involves an interest rate assumption for future periods.
One way to interpret the present value model for farmland prices is that there is a relationship with lease income from passive investors, or cash rental rates, as the measure of ownership returns. Approximately 64% of farmers rely on rental markets to access some portion of their agricultural land base, and 70% of rental agreements are fixed cash leases (Bigelow, Borchers, and Hubbs, 2016). The stream of future cash rental rates helps determine the current valuation of farmland, as expected higher returns increase values (and vice versa).
Farmland values moved up sharply in 2021 across the Midwest (see figure 6) and continued to move up in 2022. This implies that buyers expected farmland returns to move up in the future without getting discounted away. The role of climate change in these valuations may not be fully accounted for, but so far there doesn’t seem to be inordinate concern about the negative consequences of climate change on Midwest farmland values.
6. Nonirrigated cropland values, fourth quarter 2021
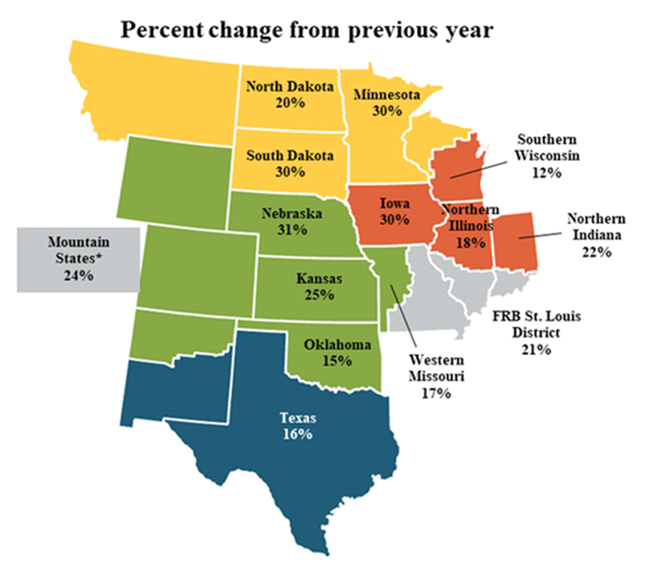
Source: Federal Reserve Bank of Kansas City.
Potential offsets for climate change impacts
In fact, there are several ways in which climate change could benefit midwestern agriculture. Climate mitigation through changes in farming practices, leading to enhanced carbon sequestration in soil (for example, by planting cover crops and reducing tillage of fields [Guenet et al., 2021]), could earn extra income for midwestern producers to fortify their balance sheets in the face of climate change. Bolstering the revenue stream from agricultural land in this way may actually draw additional investor interest, keeping farmland values higher than they otherwise would have been. Markets for the mitigation of climate change are still developing, so revenues from such activity have been minimal up to now.
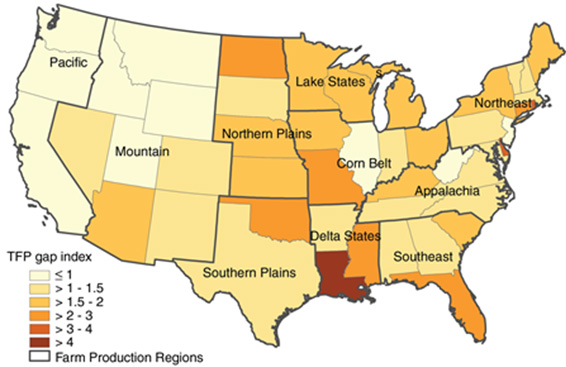
Another angle to consider is the role of agricultural productivity, which could delay or alter the results of climate change. States across the Midwest vary in the ability of their farms and ranches to innovate (see figure 7). Over the decades there have been dramatic increases in agricultural output, while labor and physical inputs have continued to be relatively constant. The benefits from new technologies and improved farming techniques may not be as feasible going forward, however, given declines in funding for public agricultural research. Private research, on the other hand, has picked up much of the slack, driving agricultural productivity higher. So, the agricultural sector may have the capacity to produce a lot more and more efficiently in the future.
7. Change in agricultural productivity by state, 1960–2004
Source: USDA.
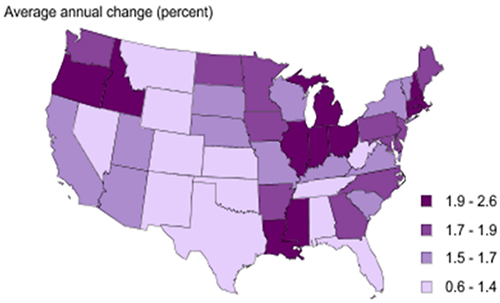
Additionally, the changing climate is not likely to affect agricultural productivity equally across the Midwest (see figure 8). USDA research suggests that some states will see degradation of their farm sector, while other states will maintain or improve their agricultural productivity. This spatial aspect will complicate the understanding of the impacts of climate change on Midwest agriculture as a whole. However, the threat of lost agricultural productivity will continue to plague the world’s food supply, as research indicates that the equivalent of seven years’ productivity gains were lost through effects from climate change from 1961 to 2020 (Ortiz-Bobea, et al., 2021).
8. Potential effects of a 2-degree Celsius increase in temperature and a 1-inch decrease in precipitation on agricultural productivity by state
Source: USDA.
Although higher temperatures and more variable precipitation could have major negative consequences for Midwest agriculture, these same shifts could also boost farm output over some horizons. Over the latter half of the twenty-first century, wheat yields might increase, whereas corn and soybean yields would likely decline in most of the Midwest. However, there is considerable uncertainty about these outcomes, as seed technology could rapidly improve, leading to new more drought-tolerant varieties of corn and soybeans. In addition, there may be increased capital investment in irrigation. Similarly, for other agricultural products, there are likely to be major improvements in technology, along with the ability to apply knowledge in new ways, that will at least ameliorate the adverse impacts of climate change.
Federal response to agricultural risks
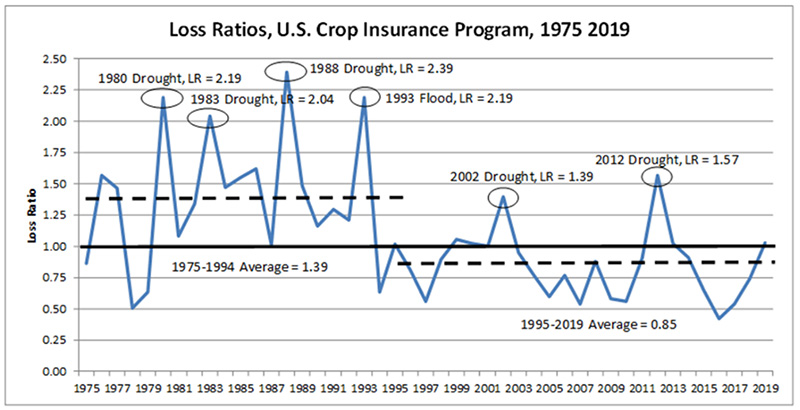
In the past, the federal government has used ad hoc government assistance programs to mitigate losses suffered by midwestern agricultural producers from weather events. In response to the repeating nature of disasters striking agriculture, the Risk Management Agency (RMA) was set up to administer the USDA’s Federal Crop Insurance Program (FCIP), which uses private insurers to help manage agricultural risk. Historically, the FCIP only provided coverage for major crops, but over the years additional products have been added (including some options to cover entire farms). As a result, the FCIP covers not only crops but also livestock and other agricultural products. From 1975 to 1994, FCIP loss ratios averaged 1.39 (see figure 9). A loss ratio above 1 for a given year indicates that large payouts led to indemnities being greater than premiums paid by the agricultural producers and the federal government. Yet, after changes to the program, FCIP loss ratios averaged 0.85 from 1995 through 2019, helped by a lower number of events leading to extraordinary indemnities. However, the likelihood of more frequent claims of large magnitudes under climate change could require adjustments to the FCIP in order to maintain its integrity over time.
9. Historical loss ratios for the Federal Crop Insurance Program
Conclusion
As a regulator of banks and jointly responsible for monetary policy as part of the Federal Reserve System, the Chicago Fed conducts research to understand the risks of climate change for the economy of the nation and of the Midwest. Given the key role of agriculture in the region, the risks associated with climate change for Midwest agriculture are the focus of this blog post. Climate change will challenge agriculture in the Midwest as long-term shifts alter interactions among the normal risks associated with weather conditions. Midwestern agriculture will likely face more extreme temperatures and precipitation, plus heat waves, more frequent droughts, more intense storms, more serious disease outbreaks, and wider spreading of invasive species. The changing climate will likely impede agricultural productivity in some areas, while there could be gains in other places (at least for a while). For instance, double cropping may expand into new areas, which will benefit operations that are able to grow a second crop. Midwestern farms and ranches remain in strong financial shape, especially considering the rapid rise in land values across the region recently. Moreover, government programs and insurance will assist in protecting the financial health of agricultural operations. Although risks to Midwest agriculture from climate change are a significant concern, the region will experience variation in the speed of events between various products and across localities, as well as in the ability to mitigate climate effects.
Notes
1 This calculation used 2021 data from the Federal Financial Institutions Examinations Council using a definition of agricultural banks as those commercial banks with agricultural loans representing at least 25% of total loans.
2 The Seventh District of the Federal Reserve System comprises the northern portions of Illinois and Indiana, southern Wisconsin, the lower peninsula of Michigan, and the entire state of Iowa.
3 For this analysis, we are looking at the eight-state region: Illinois, Indiana, Iowa, Michigan, Minnesota, Missouri, Ohio, and Wisconsin.
4 Calculations using data from https://www.bea.gov/data/gdp/gdp-state.
5 Calculations using data from Publication | Crop Production Annual Summary | ID: k3569432s | USDA Economics, Statistics and Market Information System (cornell.edu).
6 Calculations using data from Publication | Hogs and Pigs | ID: rj430453j | USDA Economics, Statistics and Market Information System (cornell.edu).
7 Calculations using data from https://usda.library.cornell.edu/concern/publications/4b29b5974.
8 Calculations using data from Publication | Chickens and Eggs Annual Summary | ID: 1v53jw96n | USDA Economics, Statistics and Market Information System (cornell.edu).


