The auto industry is a major contributor to the Seventh District economy.1 In this article, I detail how the global logistics supply chain works to get vehicles, many of which are assembled in the Midwest, to driveways, garages, curbs, and parking lots across the world.
Every year, more than 90 million light vehicles2 (i.e., cars and light trucks) roll off assembly lines around the world and make their way to buyers’ driveways. Most people spend weeks—if not months—researching their vehicle purchases and think about buying a car as a transaction: Go to the dealer, negotiate a price, secure financing and insurance, get a set of keys, and drive away. But that vehicle on the showroom floor or dealer’s lot has already completed a remarkable journey. It may have traveled over an ocean to arrive at a port; it certainly went to a vehicle processing center (VPC) to be moved by freight trains and specialized trucks called car haulers—all coordinated by a logistics industry valued at roughly $113 billion globally in 2025.
In this article, I trace that journey from the factory floor to driveway, explaining where light vehicles sold in the United States come from, what happens after assembly, and how the whole system works to deliver a car to a buyer. While auto supply chain and production vulnerabilities are widely known, vulnerabilities of the finished vehicle distribution system are not; I’ll address why this system may be more fragile than it looks—and why policymakers and consumers should care about it.
Where U.S. light vehicle sales come from
As the world’s second-largest light vehicle manufacturer (after China), the United States produces roughly 10 million vehicles annually.3 The motor vehicle, bodies, and parts manufacturing industry accounts for 4.8% of U.S. gross domestic product (GDP)4 and employs just under 1 million workers—roughly one out of every 13 U.S. manufacturing jobs.5 The jobs impact is even larger when including automotive-related businesses, such as auto dealers, logistics, engineering services, maintenance and repair, parts retailers, and car washes. In regions like the Federal Reserve’s Seventh District, automotive manufacturing plays a proportionally larger economic role than in the nation as a whole. The Seventh District states of Illinois, Indiana, Iowa, Michigan, and Wisconsin produced 30% of all U.S. light vehicles in 2025, 16% of all engines, and 35% of all transmissions.6
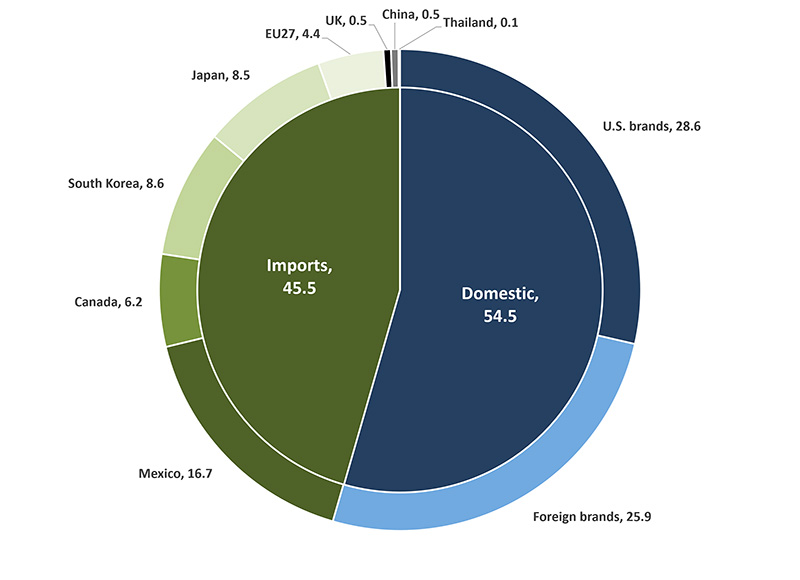
Domestic light vehicle production is only part of the story. The U.S. market is supplied by a globally integrated network of auto manufacturers, with Mexico, Canada, Japan, South Korea, and Germany as the dominant international sources of vehicles, as shown in figure 1. In 2025, nearly 55% of vehicles sold in the United States were made here, and over 77% came from plants located in North America (defined here as the United States, Canada, and Mexico).
1. U.S. light vehicle sales, by production location and brand origin, 2025
Source: Omdia by Informa Techtarget, Wards Information.
The “domestic” versus “foreign” distinction has become less clear-cut over time. The vehicle manufacturer’s name alone does not tell you where a car, truck, utility vehicle, or van was made. Some companies that are headquartered in the United States—such as Ford and General Motors (GM)—produce vehicles in other countries for U.S. sales, and the opposite is also true: Vehicle manufacturers headquartered in the Netherlands, Germany, Japan, South Korea, and Sweden built nearly 5 million vehicles within the United States in 2025.7 The best way to tell whether a vehicle was built in the United States is to check the first digit of the vehicle identification number (VIN), which can be found on the driver’s side dashboard. If the VIN starts with 1, 4, 5, or 7, it was built in the United States.8
Even for those vehicles produced in the United States, the manufacturer’s headquarters tells you little about where the parts came from to build them. The window sticker (or Monroney sticker) that is required to be on all new vehicles offered for sale in the United States will list where the vehicle was assembled; where the engine, transmission, and battery/motor (for electric vehicles) were made; and the share of parts content that came from the United States and Canada.9 Some “foreign” models made in the U.S. have very high “domestic” (U.S. and Canadian) content; these include Hyundai/Kia, Honda, and Toyota models. The Kogod Made in America Auto Index from the Kogod School of Business at American University ranks vehicle models by their total domestic content weighted by other factors, such as headquarters (where profits are accumulated) and research and development location.
Off the line: What happens immediately after assembly
The moment a vehicle rolls off the assembly line, a precisely managed logistics clock starts. Vehicles are expensive and large, and as a result, manufacturers operate on tight inventory cycles because excess finished vehicles represent significant carrying costs and face the risk of damage from weather and other hazards, plus there just isn’t that much capacity on either holding or dealer lots. Speedy and accurate outbound logistics matter, and advanced tracking systems allow manufacturers, dealers, and customers to track a vehicle’s location in real time.
Step 1: End-of-line quality inspection
Every vehicle leaving the plant undergoes a final quality inspection covering mechanical systems, paint, alignment, electronics, and fluid levels. Vehicles that fail inspection are routed to repair before being shipped out. In general, it’s far easier and less expensive to fix any defects at the plant than doing so once the vehicles reach customers.
Step 2: Protective staging
Vehicles are often wrapped with protective film to shield painted surfaces and glass from chips and debris during transit. Vehicles that will be exported on oceangoing vessels require more substantial protection (which I will discuss later). The cars, trucks, vans, and utility vehicles are then staged in a holding lot near the plant and organized by destination and transport mode. Just-in-time principles help minimize the dwell time in a holding lot and quickly get the vehicles on their way to customers.
Step 3: Vehicle processing centers
Many vehicles pass through a vehicle processing center, which acts as either a coordinating point for intermodal logistics or a transition point between bulk transport and individualized delivery.
VPCs are specialized facilities located near plants or ports. At VPCs, vehicles move in status from “built” to “ready to sell.” The processes that enable this may include conducting a predelivery inspection, fixing any damage that may have incurred during transport, and installing dealer-ordered accessories, such as floor mats, roof racks, running boards, and optional protective coatings (e.g., fabric protection or undercoating). VPCs also serve as a system buffer when vehicles stack up because of port congestion, disruptions, or rail capacity problems.
VPCs are often run by third-party logistics providers, or 3PLs. These firms also manage inventory systems, customs brokerage, and last-mile coordination across the supply chain.
Three transport modes
New vehicles usually travel by several modes of transport, and a typical journey may involve a hand-off between two or three different carrier types. Each mode has distinct economics, capacity constraints, and geographic reach. Vehicles built in the U.S. and Canada largely travel by rail and car hauler, while those built in Mexico travel by rail or ocean carrier to Gulf Coast ports. Vehicles built in Asia are mostly routed to ports on the U.S. West Coast, while those made in Europe are sent to the U.S. East Coast or Gulf Coast ports. There are exceptions to these routes, and disruptions sometimes divert ships to the opposite coast.
Rail: The dominant domestic mode of transport
Roughly 75% of all new cars and light trucks sold in the United States travel by rail for at least part of their journey from the factory to the dealer.10 Rail is the most cost-efficient mode for high-volume long-distance overland transport.
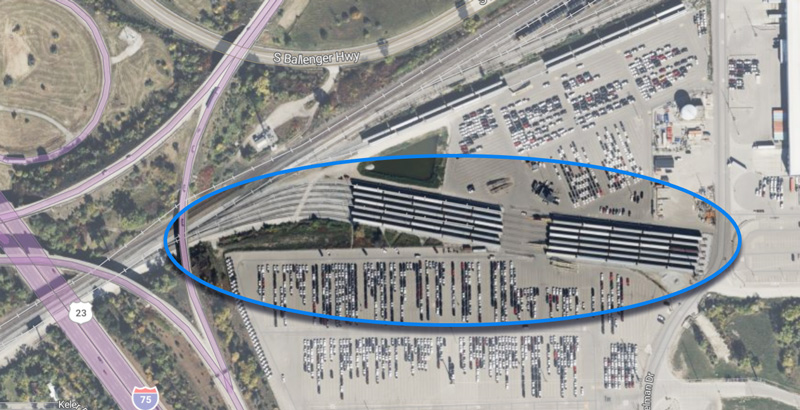
Vehicles are loaded onto dedicated autorack rail cars at the factory or VPC; bi-level rail cars can hold eight to ten larger trucks and sport utility vehicles, while tri-level rail cars can hold up to 15 passenger cars. A specialized auto transport train may move as many as 800 vehicles per trip. Most U.S. automotive assembly plants are served by a freight rail spur; see figure 2 for an example in Flint, Michigan.
2. Freight rail spur at General Motors’ truck plant in Flint, Michigan
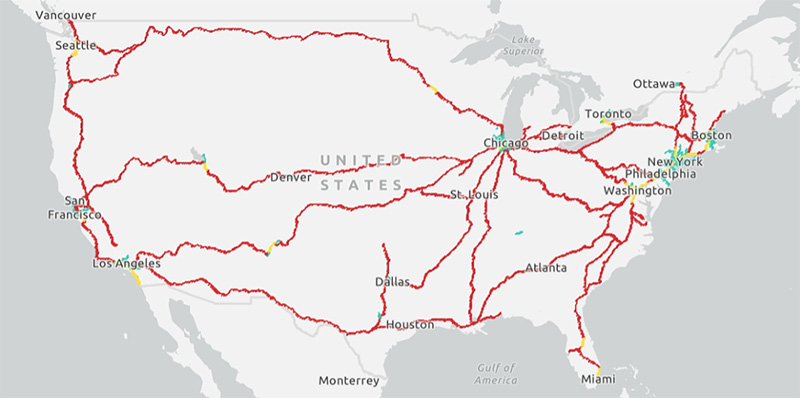
The major players in shipping cars and trucks via rail are CSX and Norfolk Southern in the East and Union Pacific and BNSF in the West. North–south routes are served by Canadian National and Canadian Pacific Kansas City. All six of these freight rail networks connect in Chicago (see figure 3), so it is highly likely that your car or light truck passed through Chicago on its way to your driveway.
3. U.S. freight rail main lines
RoRo ocean carrier: The international gateway
For vehicles that come to the United States across the ocean, be they from Europe, Asia, or North America (Mexico), the primary transport mode is the roll-on/roll-off (RoRo) vessel. RoRo ships are built for vehicle transport. They feature large ramps that allow vehicles to be driven directly aboard, positioned on the multilevel decks, and secured aboard without cranes or containers.
At the start of 2025, the median load capacity of modern RoRo ships was 6,200 vehicles, though the very largest can carry up to 10,800.11 There are a few carriers that combine vehicle shipping with cargo and even passenger travel, mostly on shorter routes. According to my analysis of RoRo shipping schedules from a number of companies and freight forwarders, I estimate that the transit time from Asia to the U.S. West Coast or Europe to the U.S. East Coast is roughly 14–18 days; reaching the opposite coast via the Panama Canal takes about a month, and ships will transit the canal to deliver vehicles closer to the final consumer market. The major U.S. RoRo ports are Baltimore, Maryland; Brunswick, Georgia; Charleston, South Carolina; Houston, Texas; Jacksonville, Florida; Los Angeles, California; Long Beach, California; New York and New Jersey; Norfolk/Newport News, Virginia; and Savannah, Georgia.12
Vehicles that will undergo an ocean voyage must be specially prepared. Exterior surfaces are covered with either a thin plastic film (as with domestic shipments) or a corrosion-inhibiting waxy compound that is sprayed onto exposed metal surfaces, undercarriages, and vulnerable components. Windows and vents must be fully closed and sealed to prevent salt air from getting into interior components and electronics. For fire safety, the fuel tank must be below a certain level (often a quarter of a tank). Fluids must be checked to prevent leaks on board. Tires and rubber parts require special protectants from ozone and salt exposure.
When ships unload at port, vehicles are driven off, inspected by the U.S. Customs and Border Protection, and moved to holding lots to await transfer to domestic rail and truck networks. The VPCs at ports also remove all the shipping protection and may do light assembly of market-specific components and dealer-ordered accessories.
Trucking: The last mile
The final leg of virtually every new vehicle’s journey to your neighborhood dealer is completed by a specialized truck called a car hauler. Car haulers pick up vehicles at rail terminals and port lots or directly from assembly plants and deliver them to individual dealerships. Open-air car haulers typically carry ten vehicles; enclosed rigs for luxury vehicles carry fewer.
Drivers of car-hauling rigs must have specific training and licensing to operate the hydraulic, multilevel loading systems safely. There is an acute truck driver shortage in car hauling, partly because the combination of skill requirements and operational complexity limits the pool of qualified drivers.
Destination charges
The destination and delivery charge on a new vehicle’s window sticker covers all these upstream transport costs. These fees are set by each manufacturer and are applied uniformly across the brand’s models regardless of how close or far the dealer is to the point of assembly or port.
Once the customer purchases the car at the dealer and takes it home, the trip from plant to driveway is complete.
Vulnerabilities of the delivery supply chain
The supply chain that brings vehicles from factories around the world to driveways across the United States is sophisticated and efficient, but not immune to large external shocks.
Concentration risk
The supply chain for finished vehicles is geographically concentrated at several critical nodes—ports, rail terminals, and VPCs. The impact of an infrastructure failure (such as the March 2024 Baltimore Francis Scott Key Bridge accident and subsequent collapse), natural disaster, or labor action at one of these nodes can quickly reverberate throughout the system. Rail cars and ships can end up in the wrong places, and the vehicles themselves can pile up and overwhelm capacity at holding lots. The 2020 Covid-induced halt to North American vehicle production demonstrated how disruptions in vehicle output propagate downstream. The entire outbound chain was idled, and it was not easy to restart the system.
Trade policy sensitivity
Finished vehicle flows are also highly sensitive to trade policy. When 25% import tariffs on finished light vehicles were introduced in 2025, some automakers briefly paused production and logistics planning to assess cost implications. New and increased tariffs were also imposed on auto parts, as well as steel, aluminum, and copper, in 2025 that further disrupted vehicle manufacturing and logistics. The interconnected nature of North American vehicle assembly means that tariff changes can reorganize logistics flows with considerable speed, but not without cost and disruption.
In response to the increased tariffs, automakers and suppliers have ramped up their nearshoring strategies by locating more production closer to the U.S. consumer base.13 These efforts reduce ocean-shipping lead times and mitigate tariffs but also create new dependencies on ground infrastructure and North American cross-border logistics capacity that may need investment to handle additional capacity.
Electric and hybrid vehicles and shifting logistics flows
The increasing share of electric and hybrid vehicles is another factor reshaping automotive production geography and the logistics map. Battery gigafactories are being located with or near final assembly plants to improve inbound logistics and coordination. However, battery inputs often come from very different locations than traditional parts and may travel through different ports. Additionally, there are special considerations for shipping vehicles with high voltage batteries and electrical systems on board.
With growing online vehicle sales, some manufacturers are using or testing direct-to-customer delivery; this strategy is available subject to individual state laws, and in some cases, only specific manufacturers are allowed to take this approach. Direct sales eliminate the dealer lot and represent a significant structural change to the last-mile segment of the vehicle delivery logistics chain. Shifting more volume to direct-to-consumer sales has implications for dealership infrastructure, car-hauling capacity, and the geography of VPC facilities.
Summary
The journey of a new car from the factory floor to your driveway is not simple. It involves a multimodal, multiparty, and globally integrated logistics chain—many parts of which are not visible to the end consumer. That chain moves roughly 14–18 million vehicles14 per year in the U.S. market alone. It relies on ocean carriers, freight railroads, vehicle processing centers, and specialized car haulers—all of which are coordinated in real time across a vast network of factories and sales outlets.
This complex logistics chain is responsive to a series of policy levers and external economic factors as it is sensitive to trade rules, dependent on infrastructure investment, reliant on a specialized and sometimes constrained labor force, and currently engaged in the early stages of a structural transition driven by vehicle electrification, automation, and shifting consumer buying behavior.
For the majority of consumers, the most visible part of the vehicle logistics chain is the destination or delivery charge on the window sticker. But the car in your driveway made a complex journey to get to you from the factory—whether it came from across town or from halfway around the world. The mechanics of moving vehicles is a significant economic activity in and of itself—and one for which the Chicago Fed region plays a critical role.
Notes
1 The Seventh Federal Reserve District, which is served by the Chicago Fed, officially comprises all of Iowa and major portions of Illinois, Indiana, Michigan, and Wisconsin.
2 See, e.g., Brinley (2026).
3 Omdia by Informa TechTarget, Wards Intelligence, Auto Intelligence Data Query.
5 U.S. Bureau of Labor Statistics, Employment, hours, and earnings from the Current Employment Statistics survey (national), One-Screen Data Search webpage.
6 Author’s calculations based on data from S&P Global AutoInsight. The values in the final sentence of this paragraph are for the entirety of the five Seventh District states, though, as I explained in note 1, only major portions of Illinois, Indiana, Michigan, and Wisconsin are officially in the Seventh District.
7 Omdia by Informa TechTarget, Wards Intelligence, Auto Intelligence Data Query.
8 Those wishing to decode their vehicle’s VIN can do so with the National Highway Traffic Safety Administration’s (NHTSA) VIN decoder.
9 49 CFR 583.5. The U.S. and Canada distinction arises from the U.S.–Canada Auto Pact of 1965, a trade agreement with Canada that was in force when the American Automobile Labeling Act of 1992 was enacted. The labels (i.e., window stickers) were required starting with model year 1995 vehicles.
10 Association of American Railroads (2023, p. 6) and Union Pacific (2020).
11 See Notteboom and Pallis (2026), which is chapter 5.2 in the online version of Notteboom et al. (2026).
12 U.S. Department of Transportation. Bureau of Transportation Statistics (2024).
13 See, e.g., Dawson (2026), Revell (2026), Weyland (2026), Warner (2025), and Williams (2026).
14 Omdia by Informa TechTarget, Wards Intelligence, Auto Intelligence Data Query. The U.S. market number (14–18 million vehicles) is based on annual U.S. light vehicle sales over the period 2016–25.