

The following publication has been lightly reedited for spelling, grammar, and style to provide better searchability and an improved reading experience. No substantive changes impacting the data, analysis, or conclusions have been made. A PDF of the originally published version is available here.
At the invitation of the Federal Reserve Bank of Chicago, 26 Midwestern business economists met on December 9, 1987, to discuss the 1988 economic outlook. They represented the major manufacturing industries in the Midwest—steel, autos, consumer appliances, and capital goods, as well as the financial and retail sectors. The focus was on the national economy, but the discussion reflected economic issues relevant to the industrial Midwest. This issue of the Chicago Fed Letter presents a consensus outlook for 1988, based on the median of 22 forecasts submitted by these business economists. Their views do not necessarily represent the views of the Federal Reserve Bank of Chicago. However, we value the judgments of these experienced economists, and we hope our readers will find their insights useful.
While the participants were concerned about the October Crash in the stock market and about rising interest rates prior to the Crash, they generally expected continued economic growth in 1988, though at a slightly slower pace than in 1987. The economy will be led by the investment and trade sectors, with the consumer sector causing the most uncertainty.
Before examining the consensus outlook in more detail, let’s place the outlook in perspective by briefly reviewing the history of the current expansion.
Setting the stage for 1988
Beginning in the fourth quarter of 1982, the first six quarters of the current expansion were very robust. Real GNP (i.e., gross national product in constant 1982 dollars) rose at an average annual rate of 7 percent, strong performance compared with an average annual growth of about 4 percent over the previous five expansions.1 Autos, housing, and capital goods, especially computers and office machinery, were driving forces behind the early strength of the expansion. Unfortunately for domestic producers, imports were growing at about a 26 percent annual rate on average. This was three times the average rate of import growth experienced during the last five expansions and absorbed much of the growth in domestic demand.
1. Growth consensus for 1988
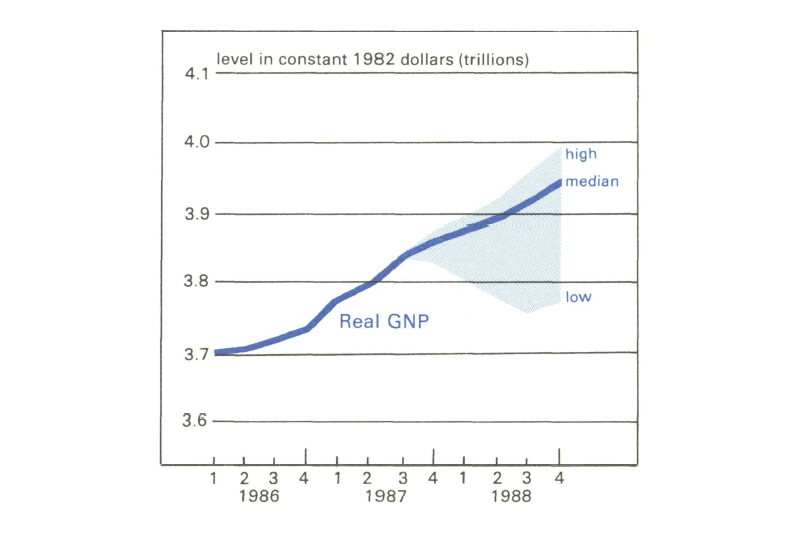
Since mid-1984 domestic producers have had to contend with a marked slowdown of economic growth. From mid-1984 to the end of 1986, real GNP grew at an average annual rate just below 3 percent, or roughly 10 percent slower than the average of past expansions over a comparable phase of an expansion. More important to domestic producers, industrial production growth dropped from a 13 percent average annual growth rate during the first six quarters of the expansion to roughly 2 percent until 1987. Simply put, industrial production was expanding at only two-thirds the pace of real GNP after mid-1984. Moreover, capacity utilization rates were consistently below median levels of the past five expansions, despite the fact that some industries were reducing capacity throughout the 1980s.
Prior to the October Crash, economic momentum was beginning to build. Over the first three quarters of 1987, real GNP rose at an average annual rate of nearly 4 percent, led primarily by investment and export growth. At the same time, industrial production had accelerated to an annualized 5 percent pace. Inventory building was a potential problem, especially in the auto industry, but operating rates in manufacturing finally achieved a median level for the late phase of an expansion. Even the long-troubled domestic steel industry, running at roughly an 85 percent operating rate overall, was nearing its capacity on certain types of steel.
2. The three-speed expansion

Rising interest rates prior to the October Crash caused some economists to revise their 1988 forecasts downward. The Crash, moreover, caused further widespread uncertainty about the strength if not the sustainability of the expansion. Consequently, forecasters were reappraising their output and price expectations for 1988 in light of the rapid change in financial markets.
1988: no recession, but…
At the time of the December meeting, it was not at all clear what the impact from the October Crash would be. While few economists expressed the view that the Crash would bring a recession in 1988, many of those attending the meeting were themselves turning somewhat “bearish.” Ten economists reported that they had lowered their projections for l988’s economic growth slightly from what they were anticipating prior to the Crash, and some were making contingency plans based on an increasing likelihood of a recession. The remainder of the forecasts were essentially unchanged by the events of the Crash.
The consensus outlook, according to the median of the 22 forecasts, was that real GNP growth will hold to a 2.3 percent pace in 1988, not much less than the 2.7 percent in 1987 on a year-over-year basis. (See table.)2 Five forecasts indicated that real GNP would be higher in 1988 than in 1987, but only two of the five were more than two-tenths of a percentage point higher. The basis for the relative optimism in these forecasts stemmed from expectations of stronger consumer spending than found in the consensus.
3. Median forecasts of change in GNP and related items, from a conference of business economists
| 87Q4 | 88Q1 | 88Q2 | 88Q3 | 88Q4 | 1987 | 1988 | |
|---|---|---|---|---|---|---|---|
| Change in levels seasonally adjusted (annual rates) | |||||||
| GNP in constant (1982) dollars (billions) | 20.6 | 14.4 | 17.3 | 25.1 | 26.0 | 100.3 | 87.7 |
| Personal consumption expenditures | –1.2 | 10.5 | 12.3 | 12.4 | 14.0 | 49.0 | 43.8 |
| Business fixed investment | 4.3 | 3.0 | 2.5 | 3.0 | 4.0 | 5.2 | 24.1 |
| Residential construction | –1.8 | –2.0 | 0.0 | 1.0 | 1.1 | –1.2 | –5.0 |
| Change in business inventories | 5.6 | –0.4 | –5.0 | 0.0 | 1.7 | 18.1 | –15.0 |
| Net exports | 12.6 | 7.8 | 7.2 | 7.0 | 7.0 | 14.0 | 22.9 |
| Government purchases | 11.7 | –0.5 | 3.0 | 5.0 | 3.7 | 15.4 | 15.0 |
| Percent changes (annual rates) | |||||||
| GNP in current dollars | 4.8 | 4.9 | 5.9 | 6.3 | 6.4 | 5.8 | 5.7 |
| GNP implicit price deflator | 2.7 | 3.4 | 3.7 | 3.7 | 4.0 | 3.0 | 3.5 |
| GNP in constant (1982) dollars | 2.2 | 1.5 | 1.8 | 2.6 | 2.7 | 2.7 | 2.3 |
| FRB Index of Industrial Production | 3.7 | 2.1 | 1.8 | 3.0 | 2.7 | 3.5 | 3.1 |
While only two economists expected a full-fledged recession in 1988, the quarterly pattern of the consensus forecast for real GNP suggested slow growth in the first half—two consecutive quarters of less than 2.0 percent real GNP growth. The strengthening over of the year was distributed across the board, with only net exports showing a smaller dollar increase in the fourth quarter than in the first quarter.
Views on the impact of the Crash on economic activity were mixed, despite a tendency among participants to revise their forecasts. Several economists stated that the effects were transitory and concentrated in the financial sector, with little spillover effect on the nonfinancial sector of the economy. One economist noted that the outlook for the nonfinancial sector might actually have improved after the Crash, because the rise in interest rates experienced over the first three quarters of 1987 had been reversed. The prevailing view of the business economists, however, was that economic growth would be adversely affected by the Crash at least over the first half of 1988.
Inflationary pressures, based on the median forecast of the GNP implicit price deflator, are expected to rise moderately in 1988, causing the deflator to rise 3.5 percent in 1988 compared with 3.0 percent in 1987. The rise generally reflects higher import prices in response to the depreciation of the dollar and to more intense use of domestic plant and equipment reflected in higher factory operating rates. Several economists noted that recent price increases were sticking for basic materials and intermediate products. Prices for some construction materials, however, have weakened.
Finally, the rate of industrial production growth, which is most relevant to domestic manufacturers, is expected to slow to a 3.0 percent pace in 1988 from 3.5 percent in 1987. Still, industrial production would outperform the 2.3 percent growth in real GNP—a sharp contrast from earlier experience. The mood among the participants, therefore, was cautiously optimistic that 1988 would be a good year for domestic producers. Of course, the experience of individual producers will vary with the specific sectors they serve.
The consumer question mark
Many of the forecasters expect that the consumer sector may well be the key to how good 1988 will be for domestic producers. If consumers retrench in order to rebuild savings or lower debt, the prospects for a recession could heighten. One economist pointed out that consumer confidence dropped substantially after the Crash and remained down in November. Personal consumption expenditures, according to the consensus forecast, are expected to reflect that slip in confidence early in 1988. For the year as a whole, the forecasters look for consumer spending to rise only 1.7 percent, compared with 2.0 percent in 1987. Given the size of the consumer sector, a relatively small change in consumer spending growth could be an important factor as economic events unfold in 1988.
Auto sales are expected to be a major factor contributing to the slower pace in consumer spending in 1988. Coming off a solid 10.0 million unit sales year in 1987, auto sales in 1988 should range between 9.0 and 9.7 million units, industry economists predicted. Some decline in sales was expected in 1988 even before the Crash occurred. Thus, the slowdown may be related more to slower growth in disposable personal income than to wealth effects associated with declines in stock values. Auto production is likely to be cut back from announced levels as efforts are made to reduce stocks over the first half.
Housing starts are not likely to be a source of strength in 1988. One economist forecast housing starts at only 1.5 million in 1988. This would still represent a respectable year for the housing industry, but housing starts would be below the 1.6 million level of 1987.
In terms of housing expenditures, the consensus forecast indicated a 2.6 percent decline in residential fixed investment in 1988 (year-over-year) in marked contrast to every other year of the current expansion except 1987.
Investment—pulling the economy again
While less than the investment boom at the beginning of the current expansion, capital spending in 1988 should make solid improvements over a lackluster year in 1987. Real business fixed investment, i.e., business-related purchases of structures and durable equipment, is expected to post a 5.3 percent gain in 1988, following a meager 1.2 percent gain in 1987. Recent accelerated growth in industrial production has begun to push operating rates in manufacturing plants into the 80-85-percent-of-capacity range where investment spending typically begins to pick up.
Participants generally painted a bright picture across the board for investment. Notably, agricultural machinery sales were expected to bottom out in 1987 and should begin to improve in 1988, although remaining well below the record highs of the late 1970s. The forecasters expect truck orders to begin to improve as the profits of trucking firms strengthen. An economist for a supplier of electronic components anticipated that sales growth in 1988 will match 1987 growth, signaling in part the recovery of the computer industry from its 1986 slump. Finally, an economist for a capital goods producer stated that capital investment in the Midwest was proceeding at a high level in 1987 and was expected to continue into 1988. Much of the increase in capital spending was seen as being directed toward improvements in processes and quality consistency, especially in the steel and chemical industries.
Foreign trade—how strong a turnaround?
Improvements in the trade sector were the final source of economic strength frequently cited in the consensus outlook. The median forecast indicated that net exports (exports less imports) should add about $23 billion to real GNP in 1988, compared with $14 billion in 1987. Virtually all of the forecasters expected net trade to improve in 1988, but the extent of the anticipated improvement ranged from $5 billion to $46 billion.
Most economists credited growth in exports as providing much of the turnaround in the trade flows. Anticipated export growth in 1988 is linked to the depreciation in the dollar that had continued in 1987. The volume of imports is expected to remain at a high level. If domestic producers have been successful in trimming their production costs through employment cutbacks and improved efficiency, however, they should become increasingly competitive in world markets. Indeed, one economist reported a substantial increase in inquiries being made by foreign purchasers for domestically produced consumer durable goods.
Implications for Midwestern producers
Despite the widely anticipated slowing in growth of the economy in 1988, domestic manufacturers should continue to benefit from favorable economic trends that began in 1987. Most importantly, the trend in real net exports that has been a major source of the accelerating pace in production in 1987 should extend through 1988. Improvements in capital spending, however, will also benefit domestic producers, especially if they improve their share of the domestic market. The impact of the October Crash remains an uncertainty. But, regardless of how much the economy might slow down in 1988, domestic producers, including those in the Midwest, fare better than growth in real GNP would suggest, as seen in the consensus forecast for industrial production.
Postscript
At press time for this issue, the December 9 meeting is over a month old. Little has changed to alter the consensus presented at that meeting. The stock market has continued to be volatile and trade deficits have continued to be high. Forecasters at the meeting, however, were anticipating a relatively weak fourth quarter in 1987 (2.2 percent real GNP growth, compared with 4.3 percent in the previous quarter). It is interesting to note that the latest Blue Chip Consensus Forecast, released January 10, 1988, shows a very similar pattern to the Midwestern consensus; that is, 2.2 percent real GNP growth in 1988 (year-over-year), with the first two quarters under 2.0 percent.
The Midwest Manufacturing Index
The MMI is currently being revised and is scheduled to appear in this space next month. Revision centers around updating and expanding the data base, but minor changes in the formulas will also be made.
Newly available value-added data from the 1985 Survey of Manufacturers will be used to update the factor-share and productivity weights, which combine employment and electrical power data in the monthly index.
The electrical power coverage will be enlarged roughly 10 percent by the addition of two electrical utilities in Wisconsin and Iowa and by the enlargement of the customer sample from a utility already reporting.
Finally, a simple two-month moving average will be introduced in the electrical power data. Erratic movements in the series may occur through the reporting procedures of producers, because the billing cycle does not always correspond with the production cycle. In addition, the productivity weights will be held constant over the period of extrapolation (i.e., 1986 to present) rather than adjusted each month by a constant.
Notes
1 To be sure, the recovery phase of an expansion typically exhibits strong growth. During the first six quarters of the current expansion, however, real GNP growth was over 30 percent higher than the average growth rate during comparable periods of five past expansions. The average is based on expansions beginning in 1954Ql, 1958Q2, 1961Ql, 1970Q4, and 1975Ql.
2 On a fourth-quarter-over-fourth-quarter basis, real GNP growth is expected to show an even larger slowdown, i.e., from 3.3 percent in 1987 to 1.4 percent in 1988.


