

The following publication has been lightly reedited for spelling, grammar, and style to provide better searchability and an improved reading experience. No substantive changes impacting the data, analysis, or conclusions have been made. A PDF of the originally published version is available here.
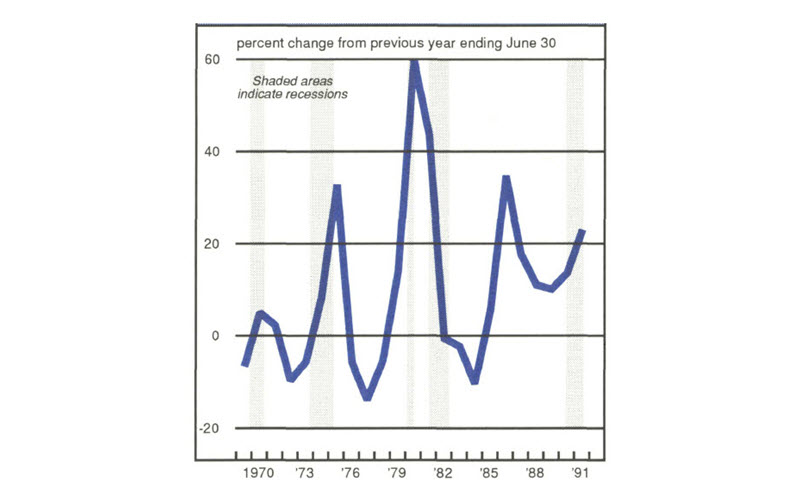
Most analysts consider the sustained increase in personal bankruptcies during the last seven years to be like a snowstorm in the middle of the summer: It should not have happened. This is because, although personal bankruptcies are historically cyclical, rising during recessions as unemployment increases and declining during expansions (see figure 1), the increase in personal bankruptcies after 1984 occurred during a period of extended economic growth.
1. Personal bankruptcy estates
Many proposed explanations for why personal bankruptcies increased during a period of national economic upswing assume that the upward trend in the number of personal bankruptcy filings during most of the 1980s was countercyclical. However, an alternative explanation is that personal bankruptcies responded to a series of localized economic downturns which took place during the 1980s. This conclusion is consistent with the claim that personal bankruptcies continued to follow a cyclical pattern. This explanation is supported by the fact that although the longest peacetime expansion in the history of the U.S. economy occurred post-1982, these years were also characterized by severe regional economic shocks, which caused personal bankruptcies to fluctuate accordingly.
An analysis of personal bankruptcies by state shows that, outside periods of national economic recessions, increases in personal bankruptcy filings during the past decade were more extreme in regions hit by negative economic shocks. Although the downturns of the 1980s were contained within specific regions of the country, their consequences were very damaging and often spilled over to different sectors of the economy, causing a more widespread financial distress. The fact that personal bankruptcy filings advanced also at the national level during this period attests to the severity of such localized recessions. Moreover, the Bankruptcy Reform Act of 1978, which made it easier to file for bankruptcy, and an unprecedented accumulation of household debt in the 1980s somewhat exacerbated the increase in personal bankruptcy filings during these periods of localized economic downturns.
1984-1986: The strain on farmers and the oil price plunge
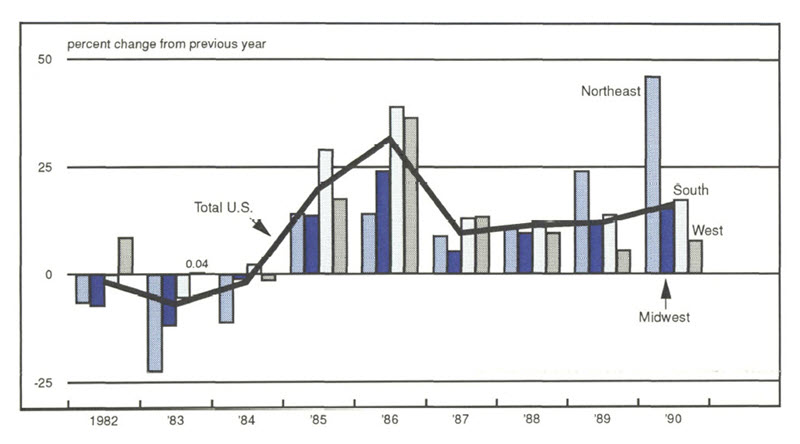
After increasing at the onset of the 1981-1982 recession, personal bankruptcy filings declined, following their cyclical pattern. The downward trend was reversed, however, when personal bankruptcies jumped 20% in 1985 and 32% in 1986 (see figure 2). The increases appeared to be countercyclical since, by 1985, the civilian unemployment rate had fallen to approximately 7% from double-digit rates in 1982, and the real economy was growing at an annual rate of 3.4%. Despite the general climate of well-being, two major economic shocks took place during the 1984-1986 period: Farmers experienced deep and prolonged financial problems, and the 1986 plunge in oil prices led to a recession in the Oil Patch states.
2. Personal bankruptcy filings by region
These localized economic disturbances forced a number of firms in the affected sectors of the economy to reduce both output and workers. As a result, in 1986, the economy’s real growth slowed to 2.7%, and employment in the goods-producing sector fell by 300,000 jobs. Also, although the national civilian unemployment rate continued to fall, unemployment rates in the states most affected by the localized economic downturns increased. Because personal bankruptcies are sensitive to fluctuations in the unemployment rate, as unemployment increased in the distressed states, so did the number of bankruptcy filings.
In the early 1980s, the agricultural sector experienced severe financial problems, mainly due to a decline in U.S. farm exports. At the beginning of 1985, over 12% of all U.S. farms were considered financially distressed by the U.S. Department of Agriculture, with 60% of such farms concentrated in the Corn Belt, the Great Lakes states, and the Plains.1 Moreover, the adverse effects of this difficult economic situation soon spilled over to agriculture-related industries, creating a more widespread economic disturbance.
In 1985, personal bankruptcies rose 20% at the national level. However, increases were clearly more dramatic in financially distressed farm states. All of the Corn Belt states reported increased personal bankruptcy levels during this period, with filings up 45% in Iowa and 22% in Missouri. In the Plains states, North Dakota and Texas reported increases above 30%, and South Dakota, Kansas, and Oklahoma showed gains above 20%. On the other hand, more than half of the northeastern states, for example, reported increases of only about 10%. Although not all of the increase in personal bankruptcy filings in 1985 can be explained by the agricultural slump, the disparity in bankruptcy increases between farm and nonfarm states indicates that personal bankruptcy levels were dramatically affected by a regional shock to the economy.
In 1986, a sudden plunge in the world price of oil led to a recession in the Oil Patch states, mainly in the Southwest (Texas, Oklahoma, Louisiana, and Arkansas), and the West (Alaska, California, Wyoming, Arizona, and Colorado). Domestically, the spot price of West Texas intermediate crude oil fell from an average of $30 per barrel in November 1985, to an average of $11 per barrel in July 1986. The plunge in the price of oil had severe financial consequences in the oil and gas industries, and in several petroleum-related sectors. The number of new crude petroleum and natural gas wells drilled was almost halved between 1985 and 1986, while oil and gas extraction output fell 13% during the same period. Unemployment in the mining sector and petroleum-related industries rose sharply, as did unemployment rates in the states with the largest production of crude petroleum and natural gas. In the affected states, unemployment averaged over 8% in the West and almost 10% in the South. These unemployment rates were considerably higher than the national rate of 7% and the average rate of 5% in the Northeast. Again, the states with the highest unemployment rates also recorded the largest increases in personal bankruptcies.
In 1986, personal bankruptcy filings jumped 32% nationally, with a 39% increase in the South and a 36% rise in the West (see figure 2). Moreover, personal bankruptcies rose by more than 50% in Alaska, Arizona, Colorado, Texas, and Oklahoma, and by more than 30% in California, Wyoming, and Louisiana. Both the Northeast and the Midwest, on the other hand, reported more moderate upswings in the number of filings in 1986, with increases of 14% and 24%, respectively.
Such considerable disparity in the magnitude of bankruptcy increases among regions was mostly due to the fact that the negative economic shock, which contributed to the increase in personal bankruptcies, was localized in the Oil Patch states. One study indicated, however, that personal bankruptcies continued to grow at the national level even when five of the major oil-producing states were excluded from the calculations.2 One possible explanation for this phenomenon is that although the initial economic shock was confined to the Oil Patch states, its financial consequences were more widespread, as other petroleum-related sectors were affected by the oil slump. Moreover, the unprecedented increase in consumer debt during the 1980s made it more difficult for those households affected by the oil recession to deal with unexpected financial strain.
Because personal bankruptcy filings sometimes respond to recessions with a lag, economic downturns can affect bankruptcy levels over extended periods of time. When individuals are laid off, they do not file for bankruptcy immediately. They first try to find new jobs, migrate to economically healthier regions, or borrow money from their families and friends. Studies show that approximately 80% of all bankrupt individuals are employed when they file for bankruptcy. However, their job tenure is usually shorter than that of the average population, and their salary lower compared to other workers in the same position. This suggests that unemployment originally forced them to look for another occupation—often a lower-paying job—before filing for bankruptcy. Moreover, the fact that personal bankruptcies sometimes respond to economic downturns with a lag explains, in part, why personal bankruptcies did not decline after 1986, although the rate of increase slowed considerably during the three years that followed.
1989-1990: The real estate slump
During the latter part of the 1980s, changes in the number of personal bankruptcy filings again varied considerably among states. During the 1987-1990 period, personal bankruptcies rose at an average annual rate of 13% at the national level (see figure 2). Although filings also rose at the regional level, certain states reported smaller increases, while other states reported declines. The disparity can be explained by another localized economic disturbance; in this case, the 1989-1990 real estate slump in the New England states.
Between the third quarter of 1989 and the first quarter of 1990, the average sale price of new homes in the Northeast fell almost 10%. Moreover, during all of 1989, while new home sales edged down 4% nationally, sales plunged 15% in the Northeast. A depressed real estate market can have serious financial consequences not only for homeowners, but also for other sectors of the economy. If homes are not selling, housing starts decline, developers and real estate brokerage firms are forced out of the market, and construction-related industries reduce output and workers. The end result is that unemployment increases across sectors, and consumers’ finances are considerably weakened.
A home is often a household’s most valuable asset for two main reasons: Real estate values are often expected to appreciate, and a home mortgage usually represents the largest debt a household undertakes. In case of financial need, an individual can always sell the house to pay other obligations. However, if the real estate market is at a standstill, the debtor in financial distress will not liquidate, first, because the house might just not sell, and second, because the debtor might have to sell it at a loss. Many homeowners have found that bankruptcy can be a solution to this problem, especially when legal action has already been brought against the delinquent debtor. It is estimated that over 50% of the individuals filing for bankruptcy are homeowners.3
A delinquent homeowner might resort to bankruptcy because the filing of a petition under either Chapters 7 or 13 of the Bankruptcy Code results in the enactment of an automatic stay, which protects the delinquent debtor from foreclosure, at least temporarily. When debtors file a Chapter 13 repayment plan, they keep all of their assets, exempt and nonexempt, but forfeit their incomes for at least three years for the repayment of all or part of their debts. Usually a claim secured by the debtor’s principal residence cannot be modified. However, in a depressed real estate market, the value of the house is often less than the mortgage claim, which allows the debtor to use the Chapter 13 “cramdown.” In this case, the difference between the mortgage claim and the market value of the debtor’s house becomes an unsecured claim, which can be modified both in amount and duration.
When debtors file under Chapter 7, they have to liquidate all of their nonexempt assets, but may retain their future incomes. In this case, debtors can keep their home by simply reaffirming the claim secured by their primary residence. Because debtors are discharged from most of their unsecured debts under Chapter 7 (except for child support, maintenance, income taxes, and fraudulent debts which are nondischargeable), they can then allocate most of their future income to the repayment of the mortgage.
During the 1989-1990 real estate slump, bankruptcy seemed to be the solution of last resort for many, especially in those states most affected by falling real estate values. In 1989 and 1990, personal bankruptcies rose at an average annual rate of 35% in the Northeast, compared to averages of only 7% in the West, 14% in the Midwest, and 16% in the South (see figure 2). During this period, increases in the New England states averaged 65%, with jumps averaging over 80% in Massachusetts and New Hampshire, and increases of over 40% in Rhode Island and Connecticut.
For all of 1990, personal bankruptcies rose 16% to over 700,000 filings. During the first half of 1991, personal bankruptcies had already climbed to approximately 440,000 cases, which indicates that bankruptcy filings by individuals are still on the upward trend. The latter increase, however, is attributable at least in part to the 1990-1991 recession and is historically comparable to increases during other national economic downturns.
Conclusion
During the last seven years, increases in personal bankruptcies have been significantly higher in states affected by economic downturns. This supports the view that the upward trend in personal bankruptcies during the 1980s was not countercyclical, but reflected an economy in which, at times, a few states suffered considerable economic declines. Moreover, although these recessions were localized, their effects were often widespread, causing personal bankruptcies to rise at the national level. Studies show that other factors, such as the Bankruptcy Reform Act of 1978 and the unprecedented increase in consumer debt, indeed exacerbated the rise in the number of personal bankruptcy filings during the 1980s. Nevertheless, the evidence shows that regional economic shocks also may cause significant increases in personal bankruptcies, even during periods of national economic growth.
MMI-Midwest Manufacturing Index: Current expansion
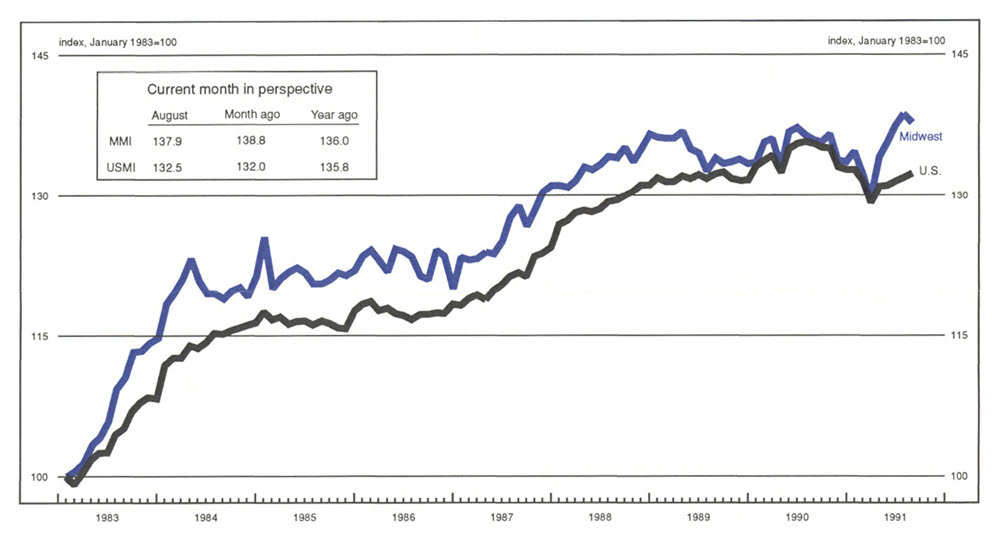
Manufacturing activity in the Midwest declined in August for the first time since its recovery began in March. The August decline was modest (down 0.6% from the previous month), compared with the monthly gains experienced in recent months. However, that decline was in marked contrast to the continued gains in manufacturing activity nationwide.
The softness in the Midwest was concentrated in the transportation and chemicals sectors of the region’s economy, which were also weak nationally. Declines in the Midwest’s chemicals sector were roughly in line with weakness nationally, but the decline in the transportation sector was substantially deeper than for the nation as a whole.
Notes
1 Economic Report of the President, February 1986, p. 133.
2 C.A. Luckett, “Personal Bankruptcies,” Federal Reserve Bulletin, September 1988, pp. 591-603.
3 T. Sullivan, E. Warren, and J.L. Westbrook, As We Forgive Our Debtors: Bankruptcy and Consumer Credit in America, Oxford University Press, 1989, p. 129.


