

The following publication has been lightly reedited for spelling, grammar, and style to provide better searchability and an improved reading experience. No substantive changes impacting the data, analysis, or conclusions have been made. A PDF of the originally published version is available here.
Over the last 20 years, Chicago has apparently moved from a manufacturing-based economy to a services-based economy, mirroring a change in the U.S. economy. Is this an accurate characterization of the Chicago economy and, if so, what are the implications for the future of the region? In order to answer this and other questions, the Regional Economics Applications Laboratory1 has been developing a comprehensive analysis of the Chicago regional economy for the last three years.2 This analysis has been derived from the Chicago Region Econometric Input-Output Model [CREIM], a comprehensive model that enables the identification of the historical differences in structure of the Chicago and U.S. economies over the period 1970 to 1990, and forecasts of the structure of the Chicago region for the period 1990 to 2000. Our goal is to try to understand the future for Chicago in terms of some of the major structural changes that have occurred in the last two decades. In so doing, we will reveal the important changes that have taken place in the nature of the economic engine that drives the region’s economy.
The economic crossroads
Twenty years ago, economists assumed that the vitality of a region’s economy was inextricably linked to the health of the region’s manufacturing sector. According to this view, only manufacturing goods could be exported, hence only manufacturing enjoyed a multiplier effect in employment, according to which jobs in export-oriented industries lead to additional jobs in firms providing inputs and consumer goods and services. However, during the period 1970 to 1990 in Chicago, employment in manufacturing declined from just under 1 million to 600,000 (see figure 1), yet the overall regional economy continued to grow.
1. Employment in Chicago
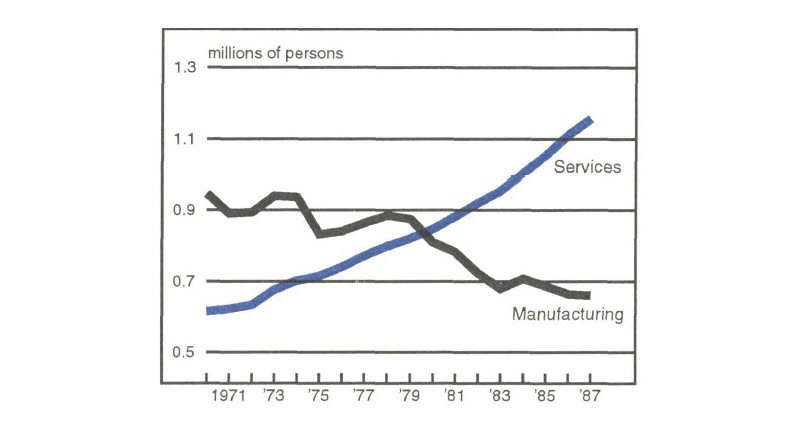
At the same time, figure 1 shows that the loss of jobs in manufacturing was more than offset by growth in jobs in the service sectors. This suggests that the view that the health of an economy is necessarily tied to manufacturing is not plausible. More specifically, it suggests that services can be exported just as manufacturing goods can, thus that the multiplier effect applies to services as well as manufacturing. In fact, the idea that services such as insurance and financial services can be exported is well accepted.
In order to understand why employment in both manufacturing and services in Chicago has changed in the last 20 years, we need to look at the causes of changes in employment and their multiplier effects. We have identified three major factors that account for changes in employment: productivity (changes in the amount of output produced with each unit of labor); demand (changes in the nature and location of demand for the products and services produced); and business practices (changes in the way in which the goods and services are produced). Each of these factors contributes to potential changes in the multiplier effect associated with the major sectors in the economy, creating further job losses or gains. CREIM provides a complete accounting of the ways in which changes in one sector of the economy affect the rest of the region. In this way we can create a picture of the economic interactions (purchases and sales) among the sectors in the Chicago regional economy for the mid-1970s and again for the mid-1980s. A comparison of these two pictures enables us to determine the causes of change in employment levels. For ease of exposition, we have focused attention on manufacturing and services only.
Why employment in manufacturing and services has changed
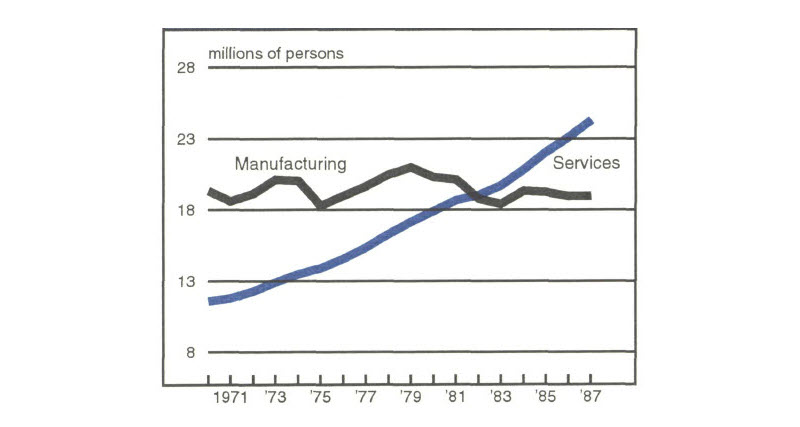
As shown in figure 2, the transformation of the Chicago regional economy from manufacturing dominance to service dominance occurred at least two years earlier than a similar phenomenon at the national level. This “crossroads” represents an important indicator of the structural changes that were taking place throughout western economies. The fact that it occurred earlier in Chicago than for the nation as a whole is surprising given the general perception of Chicago as an old (and decaying) manufacturing center.
2. Employment in the U.S.
There has been a great deal of conjecture about the causes and consequences of a replacement of manufacturing jobs by service jobs. Average wage levels in manufacturing are higher than those in the service sectors; however, there are significant variations in wage levels within the detailed manufacturing sectors such as food and kindred products and fabricated metals. These differences appear to vary with the size of the establishment, higher wage levels being found in the larger establishments. In addition, the degree to which a local firm or establishment purchases and sells within the Chicago region is a more important determinant of its effect on the economy than whether the firm is in the service or manufacturing sector. In particular, the percentage of purchases made within the region has a major influence on the size of the multiplier effect.
One effect of the switch from manufacturing to service dominance was that in many cases, those who lost manufacturing jobs did not find comparable employment in the growing service sectors. Rather, new jobs in the service sector were taken by new entrants to the labor force.
The loss of manufacturing jobs did not reduce the volume of production in manufacturing in Chicago; in fact, real output (adjusted for inflation) in 1987 was approximately the same as in 1970. However, this production emanated from a smaller number of establishments; in addition, we have developed evidence that over the period from 1982 to 1987, there was a decline of between 10% and 20% in the proportion of intermediate inputs that were purchased by Chicago manufacturing establishments from other establishments within the region. Major components of the commodity chain have disappeared as manufacturing firms in Chicago have increasingly imported more of their inputs from outside the region. One of the significant consequences of this process has been the decrease in the multiplier effect.
Many manufacturing businesses closed or relocated outside Chicago due to international competition, the attraction of new investment opportunities elsewhere in the U.S., and the belief that wage costs were higher in the Midwest. In the 19 two-digit manufacturing sectors represented in Chicago in 1987, wages and salaries accounted for between 9% and 31% of total costs. By comparison, the variation was between 9% and 26% for the U.S. as a whole, and in all but three sectors, Chicago’s percentage exceeded that for the U.S. However, wage rates alone may be a misleading indicator of the productivity of a region’s labor force. To begin with, average wages and salaries vary significantly within sectors. In the food and kindred products sector (SIC 20) in Chicago in 1987, for example, the average wage and salary in larger manufacturing firms (sales greater than $15 million) was almost twice that paid in the smaller firms (sales less than $5 million). However, larger firms had a significant advantage in sales generated for each dollar spent on wages and salaries. Within all the two-digit manufacturing sectors in Chicago, sales in larger firms were often 30% to 50% (and in one case, almost 80%) higher than in smaller firms for every dollar spent on wages and salaries. While high wages may have contributed to the decline of manufacturing, attention needs to be focused on the productivity of expenditures on wages and salaries and not just on the levels.
When Chicago is compared to the U.S. as a whole, its manufacturing productivity has been greater for all but a few of the last 20 years and has even exceeded that for Japan in the last eight years (see figure 3). The good news is that the manufacturing establishments that have remained in Chicago are, apparently, the more competitive ones; the bad news is that improvements in productivity have resulted in fewer jobs. The manufacturing engine is smaller, more efficient but, as we will see, experiencing continual erosion of its preeminent position in the region’s economy.
3. Productivity changes
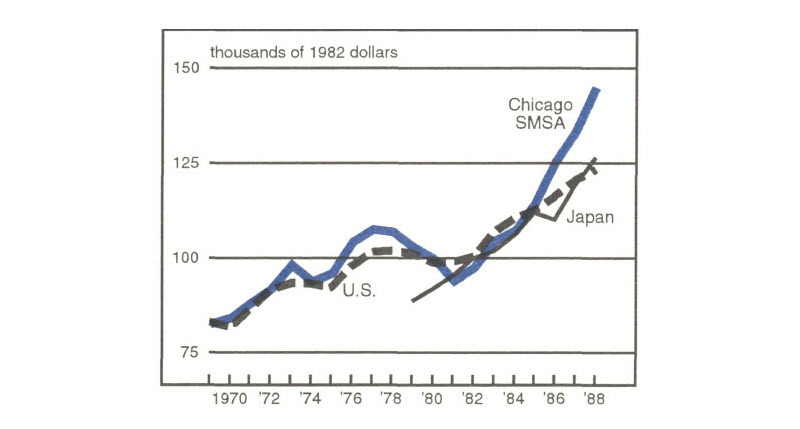
Figure 4 shows the decomposition of change in manufacturing and services employment according to the effects of changes in productivity, demand, and business practices. Note that changes in business practices have been an important component of the change in employment in manufacturing. In fact, all sectors of the economy have reduced their purchases of manufactured products between the 1970s and 1980s. Improvements in labor productivity have similarly contributed to a reduction in employment demand in manufacturing. On the other hand, for services, the major explanatory variable is increase in demand. There is no doubt that increases in female labor force participation changed not only the structure of employment but also changed the volume and composition of demand generated by larger numbers of two-earner households. Until the late 1980s, there was little evidence of improvements in labor productivity in services. However, the same phenomena that affected manufacturing a decade or so ago (pressure to contain labor costs and to improve labor productivity) appears to have become a factor in the service sector; here, labor costs are an even higher percentage of total costs (ranging from 22% to 55%) and during the recent recession there has been substantial labor shedding in the service sector as firms strive to gain an edge in an increasingly competitive environment. There seems to be considerable pessimism about the prospects for the recovery of many of these jobs as the economy continues to increase growth. Historically, there were similar significant improvements in labor productivity in agriculture and manufacturing. However, these improvements occurred over a much longer period of time than appears to be happening in the services; perhaps a century in agriculture, and several decades in manufacturing, compared to the significant productivity changes taking place in the service sector in less than a decade.
4. Decomposing employment change
(1972-79 vs. 1980-87, percent change)
| Manufacturing | Services | |
|---|---|---|
| Productivity | –2.8 | 0.3 |
| Demand | 0.6 | 6.4 |
| Business practices | –3.3 | 1.7 |
| Total | –5.5 | 8.5 |
How will services move the economy over the next ten years?
CREIM enables us not only to produce a photograph of the region’s economy but to project this photograph into the future. Using establishment level data as well as data on population, occupations, and expenditures, CREIM captures Chicago’s unique economic structure by portraying the complex interactions, purchases, and sales relationships among establishments within the region and the ways in which incomes are spent. In this way, CREIM provides a more accurate prediction of the future than would be possible from observing national trends alone.
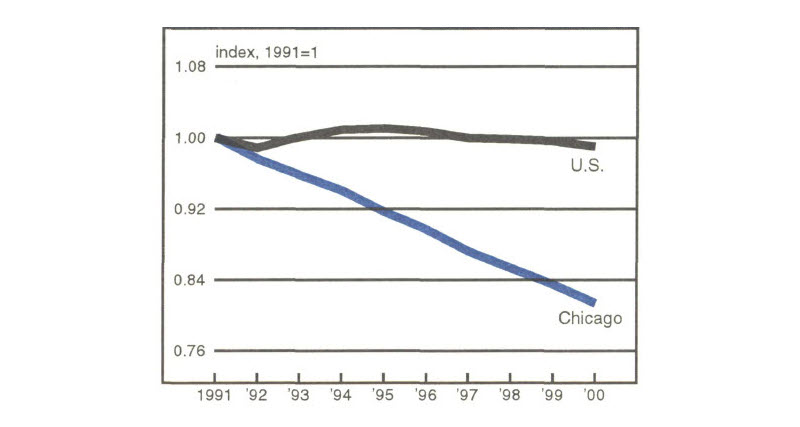
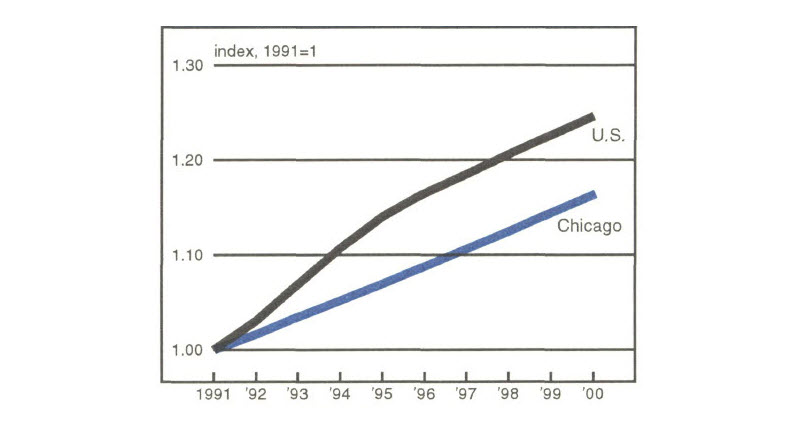
Figures 5 and 6 show the forecasts that we have made of manufacturing and service employment, indexed to the respective base level employment observed in 1991 in Chicago and the US. Note that the prospects for manufacturing are decidedly less attractive in Chicago than in the rest of the U.S. where the growth will be flat to mildly negative. We anticipate that the trends established in the last 20 years will continue; while manufacturing employment will continue to decline (a further loss of as many as 100,000 jobs), output will decline more slowly. Once again, the suggestion is that improvements in productivity will offset the decline in employment to some extent. The differential between service employment growth in the U.S. and Chicago is much less pronounced; the divergence at the beginning of the decade will narrow, with both economies exhibiting similar growth rates for the period from 1996 to 2000.
5. Projected manufacturing employment
6. Projected service employment
Conclusion
Over the past two decades, Chicago’s economy appears to have become more like the nation’s in terms of the proportion of employment in each of the major economic sectors. Not only is the Chicago economy more diversified but, more importantly, there is much greater diversification in the sectors that are exporting goods and services and in the location of the markets for these exports. Chicago’s dependence on its hinterland (the Midwest) continues to play an important role, but exports to Canada, to Mexico and to emerging markets in Eastern Europe and Asia have allowed the local economy to assume a more involved role in the international community.
Thus, while the decline of a major sector can never be referred to as good news, the erosion of the manufacturing base in Chicago has been accompanied by the development of a service sector that has enabled the region’s economy to diversify in a way that may position it to be more competitive in the next decade than if it had remained dominated by manufacturing alone.
Tracking Midwest manufacturing activity
Manufacturing output index (1987=100)
| May | Month ago | Year ago | |
|---|---|---|---|
| MMI | 111.6 | 109.7 | 107.8 |
| IP | 109.8 | 109.0 | 106.6 |
Motor vehicle production (millions, saar)
| June | Month ago | Year ago | |
|---|---|---|---|
| Autos | 6.1 | 6.2 | 5.4 |
| Light trucks | 3.6 | 3.7 | 3.1 |
Purchasing manager’s association: production index
| June | Month ago | Year ago | |
|---|---|---|---|
| MW | 62.1 | 61.1 | 53.2 |
| U.S. | 56.4 | 63.0 | 53.5 |
Manufacturing output index, 1987=100
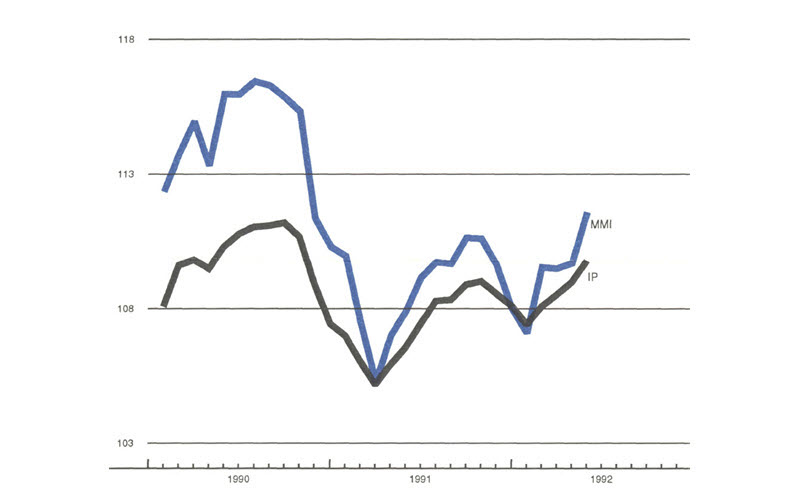
Sources: The Midwest Manufacturing Index (MMI) is a composite index of 17 industries based on month hours worked and kilowatt hours. IP represents the FRBB industrial production index for the U.S. manufacturing sector. Autos and light trucks are measured in annualized physical units, using seasonal adjustments developed by the Federal Reserve Board. The PMA survey for the U.S. is the production components of the NPMA survey and for the Midwest is a weighted average of the production components of the Chicago, Detroit, and Milwaukee PMA survey, with assistance from Bishop Associates and Comerica.
Manufacturing output in the Midwest continued to expand in May (up 1.7%), following the pattern set by the purchasing managers’ survey. May’s advance was markedly above the 0.7% gain in the nation, but more importantly represented a sustained improvement over a weak January and February for the newly revised and rebenchmarked MMI.
The MMI has generally outpaced the IP since their common low in April of last year. With June auto production down slightly and widespread expectations that the IP declined in June, the MMI may soften in June. However, with the Midwest PMA for June posting expansion and planned auto production schedules for the third quarter almost 20% above year-ago levels, the MMI should trend up over the next several months.
Notes
1 The Regional Economics Applications Laboratory is a cooperative venture between the University of Illinois and the Federal Reserve Bank of Chicago focusing on the development and use of analytical models for urban and regional economic development.
2 The regional economy comprises the following six counties: Cook, Will, McHenry, Kane, Lake and DuPage.


