

The following publication has been lightly reedited for spelling, grammar, and style to provide better searchability and an improved reading experience. No substantive changes impacting the data, analysis, or conclusions have been made. A PDF of the originally published version is available here.
If Illinois were an independent country whose Congress was in the process of determining which economies should be granted Most Favored Nation status, the countries shown in the top part of figure 1 would be the prime candidates, assuming Illinois adopted a policy of maximizing self-interest. However, if the set of potential candidates were expanded to include states, the entries in the bottom half of figure 1 would offer far superior benefits to Illinois. Each state entry in figure 1 is larger than the sum of the international entries. Up to now, however, little has been known about interstate trade flows. While detailed monthly and annual data are kept on international trade, the last survey-based interstate trade flow data were collected in 1967. In the last 30 years, significant changes have taken place in the structure of state economies—particularly those in the Midwest—and in the relationship between the U.S. and the rest of the world.
Our analysis of the Chicago region’s economy brings to light the enormous importance of interstate trade. Using a detailed econometric input–output model, we were able to construct an annual economic photograph of the region’s economy for the period 1970–95.1 We noted that, over time, output in most sectors was increasing (in real terms), but the degree of interdependence was decreasing. This process, referred to as hollowing out, implied that the average firm was buying less from other firms within the region and selling less within the region, which raised the following questions: 1) Where are the new sources of inputs and markets for Chicago producers? 2) Why are these changes occurring? 3) To what extent is the trend beneficial to the region? and 4) What, if any, related public policies might be considered to enhance the region’s economic well-being?
1. Destinations of largest exports
| From Illinois, 1995 | |
| Canada | $6 billion |
| Japan | $2 billion |
| Mexico | $2 billion |
| UK | $1 billion |
| Germany | $1 billion |
| From Illinois, 1993 | |
| Ohio | $20 billion |
| Wisconsin | $18 billion |
| Indiana | $18 billion |
| Michigan | $18 billion |
Source: Regional Economics Applications Laboratory.
Analyzing the reasons for Chicago’s changing trade relationships, it was clear that globalization offered only a partial explanation; Chicago’s trade with foreign nations accounted for no more than 10% to 15% of total inflows and outflows. Although we now know that Chicago trades primarily with other U.S. states, until the publication of the Commodity Flow Statistics (CFS) in 1993, it was difficult to allocate the flows to specific locations. We have been able to allocate these flows, based on the CFS data and estimates generated from our models for each of the five Midwest states, Wisconsin, Illinois, Indiana, Ohio, and Michigan. In this Chicago Fed Letter, we focus on commodity flows (agriculture, construction, and manufacturing) rather than total flows (which would include a variety of service activities).
Midwest commodity flows
Figure 2 shows the origin and destination of all gross commodity flows within the five-state region. Note the magnitude of the interstate flows in the Midwest (calculated to be over $262 billion) and the degree of dependence that each state has on the other four states. The total volume of trade rivals that in the early 1990s for NAFTA participants (U.S., Canada, and Mexico), yet these trading relationships have received almost no attention in regional public policy discussions. Notable exceptions are Testa’s (1992)2 call for a regional agenda and Nagel’s (1995) promotion of trade corridors and call for considering broadly based regions as a whole.3 Each of these states has a high degree of dependence on its Midwest neighbors; on average, 34% of total outflows (exports) from any state goes to the remaining four states, while almost 39% of inflows (imports) for any state comes from the other midwestern states. Indiana shows the highest level of dependence on the Midwest at 41% of exports and 47% of imports, while Ohio has the lowest export dependence (29%) and Illinois the lowest import dependence (32%).
2. Midwest commodity flows
| Total value of commodity outflows | % outflows to other Midwest states | |
| ($1993 bil.) | ||
| Illinois | 228 | 32.1 |
| Indiana | 128 | 40.7 |
| Michigan | 130 | 37.1 |
| Ohio | 196 | 29.2 |
| Wisconsin | 93 | 34.9 |
| Total | 775 | 34.0 |
| Total value of commodity inflows | % inflows from other Midwest states | |
| ($1993 bil.) | ||
| Illinois | 185 | 31.7 |
| Indiana | 99 | 46.8 |
| Michigan | 151 | 44.9 |
| Ohio | 171 | 35.1 |
| Wisconsin | 73 | 38.7 |
| Total | 679 | 38.7 |
Figure 3 summarizes the effects of this dependence through the creation of a net balance of trade indicator. A positive sign indicates that the state in that row exports more to the state at the top of that column than it imports from that state. Illinois enjoys a positive net trade balance with Michigan, Ohio, and the rest of the U.S., while it has a negative balance with Indiana and Wisconsin. Ohio is a net importer of commodities from the other four states; it also has a negative trade balance with the rest of the U.S. Wisconsin, on the other hand, enjoys a positive trade balance with all parties shown in figure 3. As with the U.S. international trade figures, these data focus only on commodity flows. We are still calculating total trade, and we expect that some of these net balances may change when both commodity and noncommodity trade are included.
3. Balance of trade, 1993
IL |
IN |
MI |
OH |
WI | Rest of U.S. |
|
|---|---|---|---|---|---|---|
| IL | - | + | + | - | + | |
| IN | + | + | + | - | + | |
| MI | - | - | + | - | + | |
| OH | - | - | - | - | - | |
| WI | + | + | + | + | + | |
| Rest of U.S. | - | - | - | + | - |
Inter-industry or intra-industry trade?
Over the last two decades, the five state economies have become more similar in structure, as defined by the percentage of total state product allocated across all two-digit SIC sectors. As a result, one might have expected them to trade more heavily with areas that produce goods and services not found in the Midwest. What appears to be happening is that the proportion of intra-industry trade, as opposed to inter-industry trade, is increasing, due to industries becoming ever more specialized.
4. Indexes of trade overlap
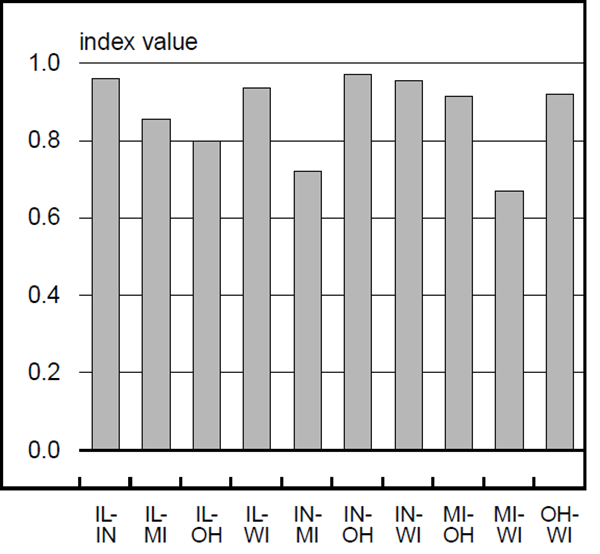
The index of trade overlap in figure 4 confirms this trend. As the index approaches 1.0, trade is dominated by intra-industry movements; for the most part, the values are in excess of 0.7 and many state-to-state pairs exceed 0.9. This suggests that Midwest firms are exploiting scale and scope economies over much broader geographies than was the case in the 1960s. Specific products for the Midwest market are being manufactured in one location to exploit economies of scale, rather than being spread over several establishments in different states. Firms are also exploiting economies of scope (the ability to produce multiple products more efficiently than single products) across multi-state establishments. Hence, the state structures appear to converge, while individual establishments within the same sector are specializing in different products. We found that the average establishment in a four-digit manufacturing sector in the Chicago region produced fewer secondary products than corresponding national establishments (aggregations across all states). Firms are exploiting scale economies in specific establishments and transporting intermediate products at various stages of the production chain across the region before they are delivered to consumers. This is possible due to reductions in transportation costs, generated by deregulation, the completion and upgrading of the interstate highway system, improvements in the competitive position of railroads, and the adoption of new technologies such as global positioning systems to track shipments more efficiently.
Taking transportation equipment as an example, figure 5 shows that the sector dominates the top ten commodity shipments between Midwest states ($54 billion in 1993). As shown in figure 6, the Ohio–Michigan exchange in transportation equipment is valued at over $14 billion. For primary metals, we found that Indiana ships over $3 billion to Illinois, while Illinois exports $1.4 billion to Indiana, making Indiana’s market in just one sector more important for Illinois than the U.K. or Germany is for all sectors (refer to figure 1).
5. Value of top Midwest commodity shipments
| Rank | Commodity | SIC | Value |
| ($1993 bil.) | |||
| 1 | Transportation equipment | 37 | 54 |
| 2 | Food and kindred products | 20 | 30 |
| 3 | Primary metals | 33 | 23 |
| 4 | Chemicals | 28 | 23 |
| 5 | Machinery (excl. electrical) | 35 | 19 |
| 6 | Fabricated metals | 34 | 17 |
| 7 | Electrical machinery | 36 | 12 |
| 8 | Apparel | 23 | 10 |
| 9 | Rubber and plastics | 30 | 10 |
| 10 | Pulp and paper | 26 | 9 |
Source: Regional Economics Applications Laboratory.
6. Midwest transportation equipment commodity flows
| % of origin | % of destination | ||||||
|---|---|---|---|---|---|---|---|
| Rank | Origin | Destination | Value | Outflows to Midwest |
Total outflows |
Inflows from Midwest |
Total inflows |
| ($ mil.) | |||||||
| 1 | Ohio | Michigan | 7,800 | 57.3 | 18.2 | 37.4 | 20.8 |
| 2 | Indiana | Michigan | 6,956 | 57.9 | 28.2 | 33.4 | 18.5 |
| 3 | Michigan | Ohio | 6,721 | 48.8 | 13.4 | 53.1 | 29.5 |
| 4 | Illinois | Michigan | 3,758 | 35.0 | 18.2 | 18.0 | 10.0 |
| 5 | Indiana | Ohio | 2,968 | 24.7 | 12.0 | 23.4 | 13.0 |
| 6 | Michigan | Illinois | 2,848 | 20.7 | 5.7 | 40.2 | 20.7 |
| 7 | Ohio | Indiana | 2,722 | 20.0 | 6.4 | 34.5 | 22.1 |
| 8 | Michigan | Indiana | 2,657 | 19.3 | 5.3 | 33.7 | 21.6 |
| 9 | Illinois | Wisconsin | 2,525 | 23.5 | 12.2 | 43.4 | 30.5 |
| 10 | Wisconsin | Michigan | 2,323 | 55.9 | 27.7 | 11.1 | 6.2 |
Policy implications
How should these results be interpreted? Regional development policy often examines the tension between the exploitation of specialization and comparative advantage and the risks of concentration and the attendant policy of diversification. One could argue that in the Midwest as a whole, both these characteristics can be observed. Within a given state, establishments within each sector have become more specialized. However, aggregated over the region, considerable diversification remains. Over the last 30 years, the Midwest states have become a more integrated market, with the result that their economic fates are no longer determined by decisions made within the state alone. As long as the mix of activities that characterizes the Midwest economy is nationally and internationally competitive, the region will thrive. However, when a major sector in one state loses its competitive edge, it will have significant ripple effects on the rest of the Midwest. Figure 7 shows the impact of a change in one state’s activity levels in the transportation equipment sector on that state, on the other Midwest states, and on the rest of the U.S. For example, a loss of $1 million in auto production in Michigan would create a further loss of over $500,000 within Michigan itself, $50,000 in Indiana, $40,000 in Illinois, and $80,000 in Ohio. The losses in the Midwest represent 43% of the impact outside of Michigan.
7. Effects of changes in transportation production
| IL | IN | MI | OH | WI | Rest of U.S. | |
| (-------------------------------$mil.-------------------------------) | ||||||
| IL | 1.51 | 0.09 | 0.04 | 0.08 | 0.05 | 0.02 |
| IN | 0.05 | 1.73 | 0.05 | 0.09 | 0.02 | 0.01 |
| MI | 0.03 | 0.08 | 1.53 | 0.11 | 0.02 | 0.02 |
| OH | 0.05 | 0.13 | 0.08 | 2.04 | 0.02 | 0.03 |
| WI | 0.02 | 0.02 | 0.02 | 0.02 | 1.31 | 0.01 |
| Rest of U.S. | 0.30 | 0.40 | 0.24 | 0.57 | 0.19 | 1.53 |
| Total | 1.98 | 2.46 | 1.96 | 2.90 | 1.61 | 1.63 |
| Midwest | 35% | 45% | 43% | 34% | 36% | |
Source: Regional Economics Applications Laboratory.
There are many remaining issues to be explored. The most important one is the relationship between international and interstate trade, because many interstate trade flows end up in products that are exported from the U.S. A second issue is the degree to which this trade exchange can be maintained and enhanced. Clearly, infrastructure plays a key role; however, it is difficult to demonstrate the benefits from additions to this infrastructure. Finally, one might voice some skepticism about individual states promoting clusters of activity within the state. Individual firms have clearly been able to grasp the idea that any clustering now is at the level of the Midwest region. If that is the case, Midwest states need to see themselves more as an integrated economic model, whose competitiveness will be critical in maintaining the prosperity that the region has enjoyed of late.
Tracking Midwest manufacturing activity
Manufacturing output indexes (1992=100)
| February | Month ago | Year ago | |
|---|---|---|---|
| CFMMI | 126.1 | 127.3 | 120.8 |
| IP | 131.3 | 131.3 | 124.4 |
Motor vehicle production (millions, seasonally adj. annual rate)
| February | Month ago | Year ago | |
|---|---|---|---|
| Cars | 5.4 | 5.9 | 6.0 |
| Light trucks | 6.3 | 6.1 | 5.9 |
Purchasing managers' surveys: net % reporting production growth
| March | Month ago | Year ago | |
|---|---|---|---|
| MW | 66.0 | 59.0 | 63.4 |
| U.S. | 57.6 | 55.3 | 56.8 |
Purchasing managers' surveys (production index)
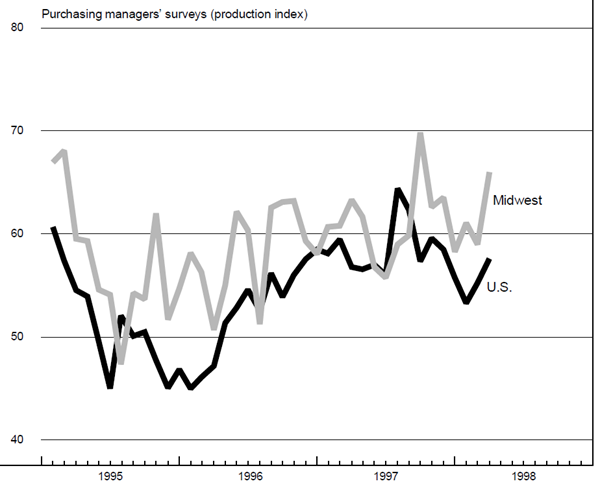
The Midwest purchasing managers’ composite index for production increased to 66% in March from 59% in February. Purchasing managers’ indexes increased in Chicago and Detroit. The national purchasing managers’ composite index increased from 55.3% in February to 57.6% in March.
Total light motor vehicle production decreased from 12 million units in January to 11.7 million units in February. Light truck production increased from 6.1 million units in January to 6.3 million units in February, and car production decreased from 5.9 million units to 5.4 million units. The Chicago Fed Midwest Manufacturing Index (CFMMI) decreased from 127.3 in January to 126.1 in February. By comparison, the Federal Reserve Board’s Industrial Production Index for manufacturing (IP) was constant at 131.3 for January and February.
Notes
1 This economic photograph portrayed the strength of what is referred to as interdependence in the economy—the degree to which firms bought and sold goods and services from one another within the Chicago region (see Philip R. Israilevich, Geoffrey J. D. Hewings, Michael Sonis, and Graham R. Schindler, “Forecasting structural change with a regional econometric input–output model,” Journal of Regional Science, 1997).
2 William A. Testa, “Emerging development strategies,” in Shaping the Great Lakes Economy, Federal Reserve Bank of Chicago, 1992.
3 Jerry Nagel, published remarks, in State and Local Economic Development Strategy Summit, University of Minnesota, 1995.
4 Philip R. Israilevich passed away on December 15, 1997.


