

The following publication has been lightly reedited for spelling, grammar, and style to provide better searchability and an improved reading experience. No substantive changes impacting the data, analysis, or conclusions have been made. A PDF of the originally published version is available here.
Since 1990, state and local governments in the Midwest have fiscally outperformed their counterparts in many other regions of the country. During the 1990-91 recession, most midwestern governments avoided major tax increases and received high marks from analysts for instituting conservative budgeting techniques to rein in expenditure growth. During the current expansion, many have begun to amass significant budget reserves that suggest that state and local finances will continue as a source of economic stability even if the overall economy declines. The question that remains is: Does this newfound stability reflect the beginning of a new era for Midwest public finance? Are the old days of fiscal crises a thing of the past, along with the massive tax increases and patched-together budgets that were so common during the recessions of 1975, 1980, and 1981-82?1
In this Chicago Fed Letter, I review the current fiscal conditions of the five midwestern states that comprise the Seventh Federal Reserve District (Illinois, Iowa, Indiana, Michigan, and Wisconsin) and discuss the challenges that await their state and local governments. While these states are currently plying calm fiscal waters, conditions may be starting to deteriorate, and at the very least the states will need to navigate several nasty reefs.
The good news: Rebuilding balances
In fiscal years 1994 and 1995, District state governments showed considerable progress in rebuilding their fund balances, as figure 1 shows. As a group, District states have taken advantage of higher-than-anticipated revenue growth over the last couple of years to shore up their reserves, rather than initiate a significant number of new programs.
1. Year-end combined fund balances
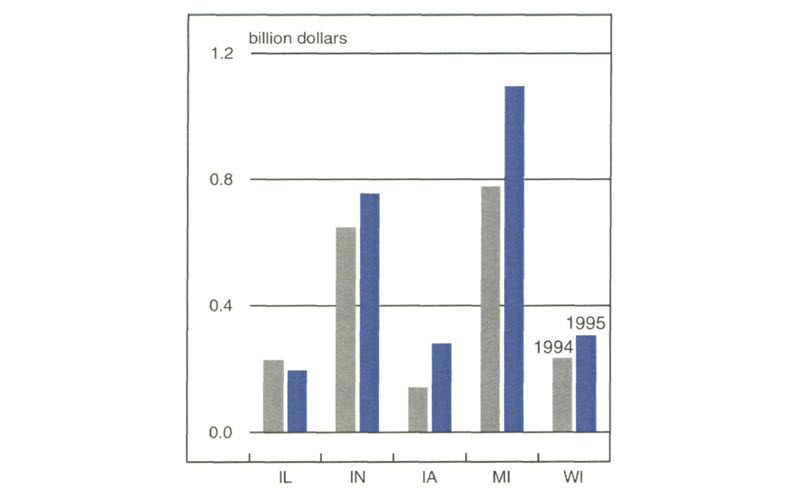
Particularly impressive has been the progress of the state of Michigan. As recently as 1991 the state was facing a $1.8 billion deficit; it has turned that around to a $1.1 billion surplus. Part of the motivation for building such a large surplus was the state’s education/tax reform package, which shifted much of the responsibility for funding elementary and secondary education to the state. This increased responsibility, coupled with legislation designed to cut state taxes by $1.5 billion over five years, makes the size of the surplus critical to the state’s ability to meet prospective fiscal demands.
Indiana has also built impressive combined reserves of over $750 million and plans to add to this total through 1997. Wisconsin, while in no immediate danger, will face a serious challenge in FY1997 when a new state law goes into effect requiring the state to pay two-thirds of the cost of elementary and secondary education. (State categorical and equalization aid currently covers roughly 40% of education costs). Funding is planned to be covered by a combination of natural revenue growth and tight budgeting, but analysts are already predicting that budget reserves may be needed if the state is to meet all its spending commitments in 1997.
Iowa has been using very conservative revenue growth projections in an effort to improve its fiscal condition. The state has reached its goal of having a balanced budget according to generally accepted accounting principles (GAAP) and is aiming to build a budget reserve of 5% of state spending by the end of FY1996.
Clearly, the state with the most pressing fiscal problem is Illinois, which recorded a GAAP deficit of almost $1.6 billion by the end of FY1994. While strong revenue growth over the last two years has helped reduce this deficit by more than $500 million, Illinois’s fiscal position remains precarious. Its inability to establish a significant ending balance means that the state is essentially working without a safety net. The Illinois budget office hopes to further reduce its deficit to $960 million by the end ofFY1996. In the meantime, however, this poor fiscal situation has not gone unnoticed by bond ratings agencies. Moody’s cited the state’s backlog in Medicaid bills as a primary motivation in downgrading the state’s bond rating in February from Aa to Al.
Internal dangers
The threats to financial stability lie both within state and local government and in external forces. One internal threat is the growing tendency for states to incur structural deficits, that is, for current and projected revenues to fall short of the operating costs of government.
Structural deficits may result from two causes. First, both state and local governments are being asked to take on broader responsibilities. This has tended to drive up expenditures as new programs bring new costs, particularly in health care and environmental regulation. Second, in seeking reasons why revenues have not kept pace with expenditure growth, many analysts have cited the reluctance of government to revise state and local revenue systems. These systems are often poorly designed to capture revenue from the fastest-growing portions of the economy.2
The best example is the general sales tax, which is still heavily weighted to the taxation of goods rather than services. With services making up an ever-larger portion of economic activity, it will be necessary to include a broad range of them in the sales tax base if that base is to grow at acceptable rates. In Illinois, studies have estimated the fiscal impact of extending the sales tax to a selected group of consumer services ranging from dry cleaning and auto repair to recreation. The findings suggest that the state could raise $500 million in revenues in the first year and expect a 5% annual growth rate from this source.3
Other internal threats to financial stability come from self-imposed state programs whose expenditure levels have grown faster than predicted. Prison spending has been a prime budget-buster for almost every state, with the growth in prison expenditures often due to new state laws creating mandatory sentencing provisions. Still, most states cite the changing roles of the federal government and the devolution of formerly federal responsibilities to state and local governments as the prime reason why state expenditures are growing faster than anticipated.
Finally, there is always the threat of tax-cut fever, although the midwestern states appear to be avoiding this potential budget problem. Whenever state revenues swell and large fiscal surpluses are established, states have a tendency to start considering tax cuts. While these can seem reasonable during good economic times, they erode the tax base and can make budgeting in times of economic downturns even more difficult.
Some states with recent weak economic performance, such as New Jersey, have ignored this conventional wisdom. They have made headlines with aggressive tax cuts designed to shrink the size of government and increase economic activity by lowering the tax costs of living and doing business in the state. As a group, the states in the Seventh Federal Reserve District have emphasized expenditure control over revenue change as a means of reining in state spending and currying favor with voters.
The external threats
The term “unfunded mandates” is often used to describe a host of federal programs, from Medicaid to environmental regulations, that require expenditures by state and local governments. Medicaid costs have proven particularly vexing. In the case of the five District states, federal Medicaid assistance matching ratios range from a high of 63% in Indiana to a low of 50% in Illinois.4 The states have complained not because they must share the responsibility for paying for Medicaid, but rather because federal lawmakers have often expanded the list of services available to Medicaid recipients. This has led to an increase in costs, which is largely beyond state control.
In response, several states have tried to institute managed care programs for Medicaid recipients, introducing private-sector cost control programs such as health maintenance organizations (HMOs) and preferred provider organizations (PPOs). Massachusetts was among the first to institute a managed care system for Medicaid. While the program has helped restrain spending increases, it has not provided the level of savings that originally had been projected. Last year, Illinois proposed a similar measure for its Medicaid program, but its application for a federal waiver to institute the program was denied.
For local governments, the cost of complying with federal environmental standards tends to raise the greatest concern. Standards for air and water quality as well as for solid waste handling often require significant expenditures. As these standards are currently scheduled to become more stringent over the next decade, local spending for compliance is likely to increase considerably. Because District states have significant environmental challenges as a result of their industrial legacy, they will face especially high costs.
Finally, perhaps the biggest external threat is the new federal budget. In an effort to balance the budget, the federal government may hand the states another problem. Funding for programs such as mass transit, highways, low-income housing, and welfare is likely to be sharply curtailed. Particularly worrisome given recent fiscal trends is a proposed cap on increases in federal Medicaid expenditures to 5% annually. Since Medicaid expenditures have consistently been growing at double-digit levels annually until recently, a 5% cap represents a cut in available resources. All of this points to either an outright reduction or a slowdown in federal funds available to state and local governments for these programs. Those governments will have to decide whether they are willing to make up the gap. Difficult decisions will have to be made as to which programs will be sustained at current levels and which will face cuts.
Derivatives: Special challenge or red herring?
One concern in the area of state and local public finance that has received considerable media attention has been the use (and misuse) of derivative investments by state and local governments. Recent events include a record-setting loss of nearly $1.7 billion by an investment pool administered by the Treasurer of Orange County, California, as well as problems in District states. Losses by Chicago’s community college system and the Wisconsin State Investment Board have heightened awareness that public finance investments have been becoming more complex and more risky.
Part of the reason why public funds are being invested in riskier financial instruments, including derivatives, is the desire to gain higher returns on public funds. In the case of Orange County, the decision was clearly motivated in part by the desire to offset slowly growing tax revenues. Rather than levying increases in tax rates, the county used its increased investment revenues to fund its operating expenses. If public pressure continues to be exerted on officials to avoid tax increases at virtually all costs, pressure to increase returns from similar non-tax revenues is also likely to continue.
Studies by the U.S. General Accounting Office and the Government Finance Officers Association suggest that the use of derivatives in state and local government investments is limited. Moreover, anecdotal evidence suggests that the negative publicity surrounding the Orange County situation has led some state and local governments to eliminate derivatives from their portfolio of investments. In fact, the huge losses in Orange County were more a product of the leveraging of fund assets than strictly from the use of derivatives.
In contrast, the more common limited use of derivatives was demonstrated in the case of the Wisconsin State Investment Board. The Board manages an investment fund for 1,000 local governments and the retired government employees’ pension fund. While the Board did announce a $95 million loss on interest rate swaps in March, this loss is relatively small against the fund’s $6.7 billion in assets and is expected to trim the fund’s investment return by only .25 percentage points.
In response to these derivative-related losses and riskier investment strategies, public finance investment officers have been pursuing efforts to clarify the use of derivatives for public funds. Proposals from the Government Finance Officers Association have recommended better disclosure rules for derivative brokers (in terms of the risks of these investments as well as the brokers’ own positions) and better accounting methods, so that the value of derivatives in government portfolios will be better understood. State and local treasurers also need to understand better how derivatives work and what their role is when it comes to investing public funds. In nearly a dozen states, legislation has been proposed to clarify if and when state or local government may invest in any form of derivative.
Conclusion
Most of the District’s state and local governments find their immediate fiscal condition better than it has been in some time. However, one need not look too far into the future to see some difficulties that lie ahead.
Certainly, more scaling back of federal programs is bound to be difficult for states and localities to absorb. In addition, as many states actively pursue more responsibility, they are at the same time often trying to hold tax bases static. It is clear that state and local governments will continue to be asked to do more. The question is whether they have the resources to carry out all that is being asked of them.
Tracking Midwest manufacturing activity
Manufacturing output indexes (1987=100)
| June | May | June ‘94 | |
| MMI | 140.1 | 140.1 | 132.9 |
| IP | 123.0 | 123.0 | 119.3 |
Motor vehicle production (millions, seasonally adj. annual rate)
| June | May | June ‘94 | |
| Autos | 6.0 | 6.1 | 6.2 |
| Light trucks | 5.4 | 5.4 | 5.1 |
Purchasing managers’ surveys: net % reporting production growth
| July | June | July ‘94 | |
| MW | 48.2 | 53.9 | 70.2 |
| U.S. | 51.2 | 46.5 | 61.0 |
Motor vehicle production (millions, seasonally adj. annual rate)
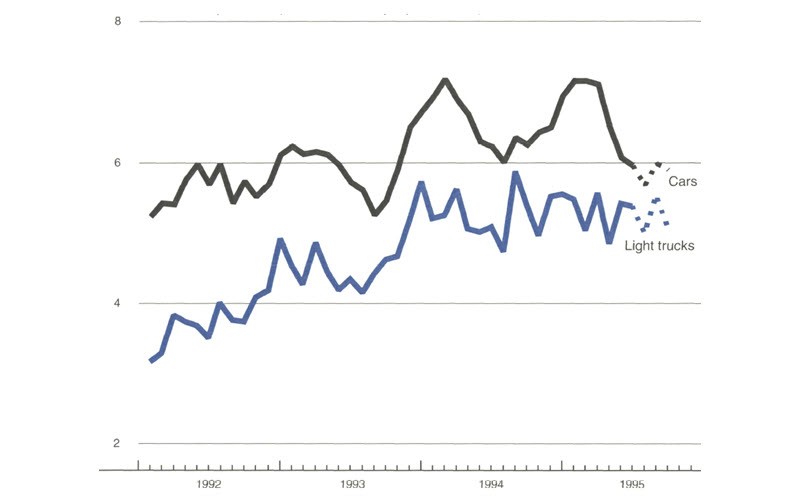
Note: Dotted lines are production estimates from auto producers.
Sources: The Midwest
Manufacturing Index (MMI) is a composite index of 15 industries, based on monthly hours worked and kilowatt
hours. IP represents the Federal Reserve Board industrial production index for the U.S. manufacturing
sector.
Autos and light trucks are measured in annualized units, using seasonal adjustments developed by the Board.
The
purchasing managers’ survey data for the Midwest are weighted averages of the seasonally adjusted
production components from the Chicago, Detroit, and Milwaukee Purchasing Managers’ Association
surveys,
with assistance from Bishop Associates, Comerica, and the University of Wisconsin-Milwaukee.
Light vehicle assemblies declined relatively sharply in the second quarter, after rising interest rates on auto loans and several other important factors put a chill on sales in the first half of the year. Interest rates on auto loans have been falling back since the second quarter, however, and incentive policies have grown somewhat more liberal. Partly as a result, industry analysts have expressed greater confidence in inventory positions in recent weeks. Current build plans imply output will remain flat in the third quarter, although these schedules are subject to revision.
Notes
1 For more on the historical performance of state and local governments in the Seventh Federal Reserve District, see Richard H. Mattoon and William Testa, “State and local governments’ reaction to recession,” Economic Perspectives, Federal Reserve Bank of Chicago, March/April 1992, Vol. 16, No. 2, pp.19-27.
2 For more on this, see National State Legislatures, Financing State Government in the 1990s, Denver, CO, 1993.
3 Center for Urban Research and Policy Studies (University of Chicago) and Metropolitan Planning Council, Paying for State and Local Government, Report of the Chicago Assembly, August 1994, p. 26.
4 Specifically, federal Medicaid assistance matching ratios for FY1995 are estimated at 50% for Illinois, 63.21% for Indiana, 62.74% for Iowa, 56.73% for Michigan, and 60.25% for Wisconsin. The range for federal reimbursement varies from a minimum of 50% to a maximum of 83% (Advisory Commission on Intergovernmental Relations, Significant Features of Fiscal Federalism, 1993, Vol. 2, M-185-II, Washington, DC, September 1993).


