

The following publication has been lightly reedited for spelling, grammar, and style to provide better searchability and an improved reading experience. No substantive changes impacting the data, analysis, or conclusions have been made. A PDF of the originally published version is available here.
State governments make major changes to their fiscal systems only infrequently. When they do take place, changes are driven by such forces as recessions, changing demographics, regional decline, and sustained revenue growth. The Seventh District has experienced all of these events over the past 15–20 years.1 A period of sustained economic and revenue growth during the mid-1990s has followed on the heels of regional decline, rising costs of public services, and recession. District states have reacted to their good fortunes by initiating innovative changes to both their tax systems and spending programs. This Chicago Fed Letter discusses how the current economic expansion is lifting state government revenues in the District and the varied fiscal responses of state governments.
The 1980s through the recession of 1990–91 was a period of almost unrelenting fiscal pressure on state and local governments in the Midwest. During the recessionary early 1980s, downturns in both manufacturing and agriculture hampered revenue growth while driving upward the demand for cyclically sensitive services, such as welfare, public health care, and unemployment insurance. Although the economy improved later in the decade, federal government (nondefense) downsizing, along with the trend toward devolution of responsibilities to state and local governments, pressured the spending side of the fiscal equation. In some areas, such as prisons and environmental regulation, federal courts or the U.S. Congress pushed costly mandates onto state government spending. On the revenue side, federal grants to state–local governments generally declined in importance during the 1980s. In addition, rising costs for state–local government services, such as Medicaid, tended to push budgets upward. Consequently, most District state governments entered the 1990s in less-than-perfect shape. Budgetary balances were low entering the 1990–91 recession, and reserves were quickly exhausted, causing state governments to scramble to make ends meet.
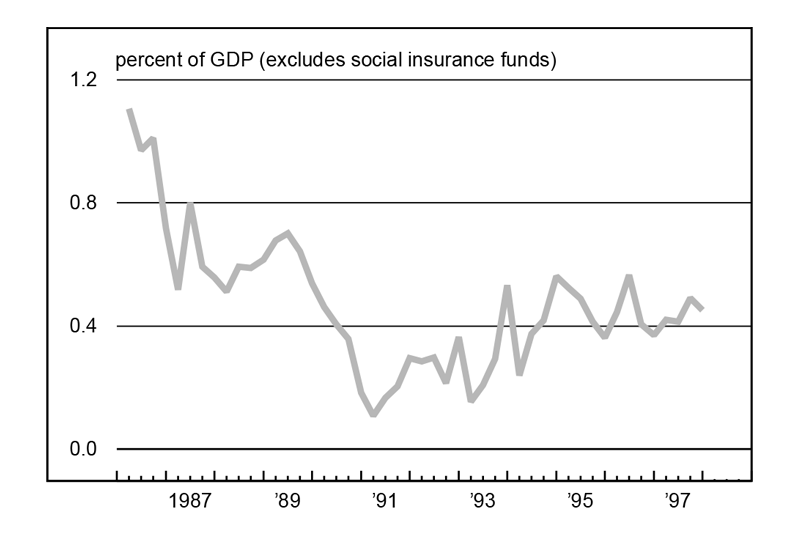
Since that time, two trends have benefited District states’ budgetary health. First, the U.S. economy has experienced its third longest expansion in the modern era. Second, the Midwest economy outperformed the nation during the first several years of the expansion. Over the past two years, the region’s economic growth has fallen short of the nation’s. Nonetheless, state governments have shared in what has been an unexpected nationwide revenue surge from income-related tax sources. What began as a worrisome decade for Seventh District states has unfolded into much improved fiscal positions, as shown by ending-year general fund balances in individual states and by the overall surplus position of the state–local government sector in the U.S. (figures 1 and 2).
1. State and local surplus
2. State government ending balances
Source: National Association of State Budget Officers and National Conference of State Legislatures.
Governments have seized this opportunity to remedy unfinished business from the 1980s and to undertake a few bold innovations. Most commonly, they have used unexpected revenue surpluses to shore up education funding. On the tax side, adjustments have taken two primary forms. First, states have lowered tax rates or broadened exemptions on existing taxes. Second, they have adjusted their aid to local governments, usually local school systems, to alleviate the tax citizens find the most onerous—the property tax.
Michigan
During the 1990–91 recession and its immediate aftermath, Michigan experienced one of the sharpest budget imbalances, ending fiscal 1992 with a general funds deficit of over $700 million. However, a surging state economy in 1993 and 1994 helped the state to avoid major tax increases or expenditure cuts, and it ended fiscal 1994 with a surplus of $400 million; revenues continued to exceed estimates well into 1995. Against this backdrop, voters approved a profound change in the state’s tax structure and its system of school funding. “Proposal A” improved school funding, especially to low-spending districts; transferred funding reliance from local to state funding sources; and remedied a perceived imbalance in the state’s revenue structure by shifting from property taxation to sales taxation (along with other tax system changes).
Michigan had adopted a “power equalizing” system of state funding to school districts in 1974. Under power equalizing, state aid was set to guarantee a schedule of revenue yields to any two school districts that taxed locally with the same amount of effort. However, the system failed to meet expectations of greater spending fairness; by 1994, the ratio of per student spending between Michigan’s highest spending districts and its lowest had climbed back to its 1974 level. Beginning in 1994–95, Michigan reverted to a system of “foundation” school grants-in-aid, whereby, with a minimum of required local tax effort, low-spending local school districts are funded by the state up to a minimum foundation level of per pupil spending. Consequently, in 1994–95, the group of lowest-spending school districts experienced a 17.5% increase in average per pupil spending, reaching $4,288. Largely as a result of this feature, inter-district variation in spending was narrowed, with other features expected to narrow spending disparities further in future years.
Prior to the changes, Michigan’s tax system was one of the most skewed in the nation. In fiscal 1994, the state revenue share ranked sixth lowest in the use of state–local sales taxation but sixth highest in dependence on property taxation.2 Of the latter, much was due to school districts tapping the local property tax base for funding; the state aid (i.e., nonproperty) share of local spending amounted to only 28.7%, versus 45.2% for the nation.
For 1995, Proposal A raised the state sales tax two percentage points, from 4% to 6%, which, along with tax hikes on tobacco, replaced the bulk of locally raised property taxes. In addition, significant local property taxation was replaced by state (single fixed-rate) taxation of property earmarked for state school aid funding. The result has been a shift of revenue sources, along with greater centralization of school funding. However, at least one school system feature has become highly decentralized. Proposal A authorized public school districts and public colleges or universities to establish “charter schools,” which are funded under the state’s new funding system but need not adhere to all of the restrictions and guidelines of state and local education authorities.
Michigan’s partial replacement of sales taxation for property taxes to fund local schools raises a concern about the long-run stability of the revenue stream; sales taxes tend to be more responsive to short-term swings in the economy than do property tax revenues. At the same time, current and prospective revenues are being reduced through the state’s reshaping of its personal income and “single business tax.” So far, this has presented no major problem because of the economy’s buoyancy.3 Personal income growth in Michigan exceeded that of both the nation and the region from 1993 through 1995. Since then, however, the state’s income growth has slowed relative to the nation.
Indiana
Much like Michigan’s, Indiana’s economy and revenue streams were significantly affected by the 1990–91 recession. Indiana avoided tax increases during and immediately following the recession, in part because it had built up substantial reserves during the 1980s. The state shared fully in the recovery, with personal income growth exceeding that of the nation from the fourth quarter of 1991 through the fourth quarter of 1993. Since then, Indiana’s income growth has only slightly lagged the nation’s.
During the recovery and expansion of the 1990s, state budget surpluses have steadily widened. At the end of fiscal 1997, the state’s ending surplus was almost 23% of the year’s revenues, up from 8.1% in 1993. Indiana’s growing budget reserves have come about largely because the state has tended to underestimate both economic growth (and its attendant tax bases) and the responsiveness of its tax system to economic growth.
Indiana plans to spend down part of the surplus in 1997–99, forecasting a general fund balance of approximately 14% for the end of fiscal 1999. Some $700 million will be whittled away through revenue cuts and state spending, including state and local road improvements and shoring up public employee pension funds. Enacted tax cuts include shaving the inheritance tax by exempting the first $100,000 left to children and grandchildren and lowering income taxes for parents by increasing the standard deduction for dependent children and supplementing the earned income tax credit.
The state has cut property taxes for homeowners by increasing the “homestead credit.” In all likelihood, property taxes will be scaled back further and partially replaced by one of several state tax sources. Surveys reveal that Indiana residents are dissatisfied with property tax levies, which increased by an average of 7.3% per year from 1990 to 1995. Enhanced county welfare services to children lay behind much of the increase, as did increased school spending. Population growth and attendant school enrollment have accelerated in the 1990s, requiring additional school construction and enhancement of school services. Rising incomes may also be financing movement of students’ families from urban to suburban areas, thereby requiring new school construction.
A pending court case may bring the issue of property tax relief to the fore. Depending on the outcome, taxable property values could be brought up to par with market values in the state. This would raise property taxes on residential property by an estimated 39%, on average. The Governor’s Commission on taxes stands ready to examine alternatives to such an outcome.
Illinois
In contrast to Indiana, Illinois entered the 1990–91 recession with its state finances in a precarious position. A modest increase in the state’s flat rate personal income and corporate taxes in 1989 was too little and too late to counteract problems that had developed during the 1980s. Consequently, the recession resulted in several deficit years and weakened fund balances. Strong downside spending measures from 1991 onward allowed the state to avoid significant tax increases, and economic recovery took over where fiscal discipline left off. In recent years, revenue gains have outpaced expectations, while costs associated with Medicaid, welfare caseloads, and the prison population have grown more slowly than expected. As a result, Illinois’ general funds balances ended fiscal 1997 at a record high level, and fiscal 1998 revenues are running well ahead of forecasts.
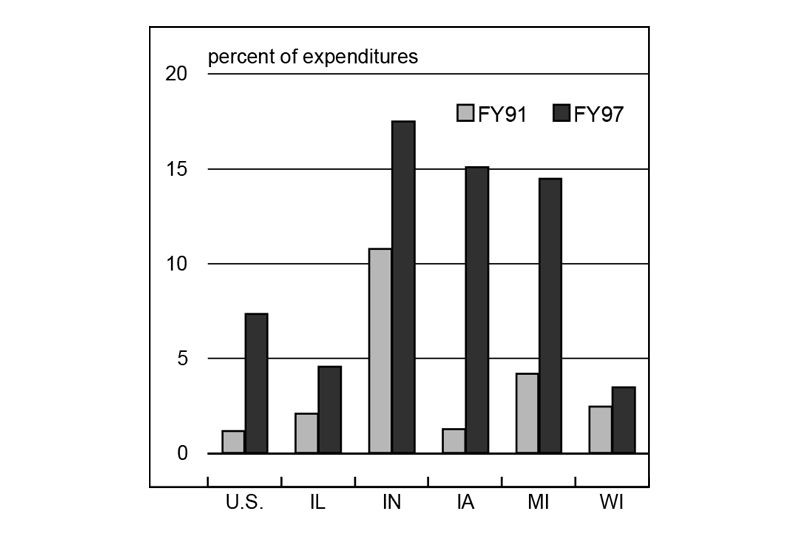
The fly in the ointment for Illinois is the familiar problem of property taxes and school funding. The state’s share of state–local funding for elementary and secondary education fell from 38.1% to 29.9% from 1985 to 1996, and its dependence on property taxation moved from 20% greater than the national average in 1985 to 22% by 1994. As local school districts have increasingly determined local school spending, many low-spending school districts have chosen to spend even less relative to state norms.
Acting on a gubernatorial commission’s recommendation for a minimum level of per-pupil spending, the state legislature considered a proposal in mid-1997 that would have raised $600 million through the state’s individual income tax for aid to low-spending school districts and replaced $900 million in local property taxation across most school districts. The legislation failed to pass, but a late 1997 session of the legislature did approve an alternative plan, which raises the state-guaranteed minimum per-pupil spending and funds construction of new schools, without raising the individual income tax or providing across-the-board property tax relief. This legislation, which implements important education reforms such as lengthening the time between hiring of teachers and tenure decisions, funds its planned expenditures through tax increases on cigarettes, telecommunications, and riverboat casino gambling, along with revenue growth from the existing tax structure.
Wisconsin
If Illinois came to the property tax reform issue late, Wisconsin came to it early. The state’s per-pupil funding for education is perennially among the highest in the nation, ranked 12th in 1995. Until recently, most of these funds derived from local property tax sources; the state share of school (nonproperty) revenue in 1994 was 48%. State aid increases to education more than doubled prior to 1994. Yet, because of rapid rises in spending per pupil, these monies were insufficient to raise the state’s share of funding, and local property tax rates continued to rise. In response, during 1994, the state committed to substantial property tax relief by increasing the share of school funding derived from state aid to two-thirds. Property taxes have fallen from approximately 5% of personal income to 4% since 1993, which is much closer to the national average.
The wherewithal to fund property tax relief has been assisted by a surging economy. Revenues slowed in Wisconsin during the past recession, but not to the same extent as elsewhere. Payroll employment growth rates in Wisconsin exceeded national levels in every year from 1987 to 1992, and for 1997, the state’s unemployment rate averaged almost 1.5 percentage points below the U.S. average. Since 1996, employment and income growth have slowed relative to the nation, largely reflecting constrained workforce capacity. Although state officials recently expressed concern about the potential effects of slowing growth on revenues to fund continued property tax relief, fiscal 1997 brought surprisingly strong revenue growth, especially from the state’s individual income tax. Observers suspect that the growth in capital gains income arising from rapidly appreciating equity markets is behind some of the upturn in tax receipts in Wisconsin, as elsewhere. For 1997–99, Wisconsin is counting somewhat on continued revenue growth to complete the funding of its property tax relief effort, while paring down individual income tax rates.
Sinking welfare caseloads have also contributed to budgetary health in Wisconsin. The state made history by negotiating with the federal government to end the right to Aid to Families with Dependent Children and was given a federal waiver before the congressional reform of 1996 ended the federal entitlement to welfare nationwide.4 Under Wisconsin’s new program, W-2 (Wisconsin Works), parents are required to work to qualify for assistance. However, the new program provides augmented services to families on assistance, including free medical services and subsidized childcare, which raise the cost of supporting each family some 60%. Hence, it cannot be casually termed an austerity measure on government’s part.
Iowa
While the late 1990s have brought significant economic progress and improving fiscal health in Iowa, the decade did not start that way. Economic recovery in the farm sector took hold somewhat later than it did in manufacturing during the 1980s. Due to its heavy dependence on the farm sector, Iowa’s fiscal position entering the recession of 1990–91 was more fragile than other District states, and its subsequent budget deterioration was more palpable. The flood of 1993 put further stress on the state’s economy and budget. In response to budget deterioration, the state legislature passed an increase of 1% in the state sales tax rate in mid-1992.
Economic recovery took a much stronger hold after 1993, and the state has since enjoyed a falling unemployment rate—currently two percentage points below the nation’s. State revenues have accelerated off both stronger growth and a larger sales tax. Iowa has chosen to use expanding revenues to provide more explicit property tax relief, increase the state portion of foundation aid to schools and other property tax relief, and add modest income tax relief for senior citizens and families with children. As a consequence, property taxes as a share of all state–local taxes in Iowa are forecast to fall from 40.5% in fiscal 1992 to 36.7% by the end of 1998.
Following four years in which revenues have exceeded expectations, the state plans to provide further property tax relief and across-the-board cuts in personal income taxes. Notably, the legislature approved the Governor’s proposal for a 10% across-the-board reduction in personal income taxes, effective January 1, 1998.
Conclusion
What began as a stressful decade for state governments in the Seventh District has become one in which surging revenues are allowing elected officials to please their constituents by offering continued tax cuts; innovative programs for services, such as welfare and education; and a shifting of revenue sources away from those taxes—especially on property—that are most unpopular. While governments are also using this period of growth to replenish their budget reserves, there are some worries on the horizon. Economic growth has slowed, perhaps as a result of limits on the availability of workers in the region. So far, strong national growth continues to lift incomes, while income tax revenue growth is being buoyed by realizations of capital gains on equity portfolios. The worry is that both economic growth and capital gains may change direction in a hurry, especially in a region noted for its cyclically sensitive economy. If so, budgetary reserves could be drained quickly, especially in states that have back-loaded the very popular tax cuts they are promising voters.
Notes:
1 The Seventh District comprises parts of Indiana, Illinois, Michigan, and Wisconsin, and all of Iowa. This article draws from a November 11 session, “Recent revenue performance and the economic conditions of midwestern states,” of the 1997 Annual Meetings of the National Tax Association, held in Chicago, Illinois. Session presenters included Mitchell E. Bean, Michigan House Fiscal Agency; Yeang-Eng Braun, Wisconsin Department of Revenue; Larry DeBoer, Purdue University; J. Fred Giertz, University of Illinois; and Joel Lunde, Iowa Department of Management.
2 In this article, dependence is measured by a revenue source’s share of total state–local tax revenue.
3 However, Proposal A increased state funds to local school districts while accelerating payments. This contributed to a cash flow concern, which has since been allayed by lengthening the payment schedule.
4 "Where Wisconsin goes, can the world follow?," The Economist, November 1, 1997, pp. 25–26.


