For much of the recent expansion, real wage growth was surprisingly sluggish, by some measures never reaching its pace prior to the 2008 financial crisis, despite tight labor markets that drove the unemployment rate to 3.5%. However, on average, the lowest-earning workers fared substantially better, consistently experiencing real wage growth of 6% or more for much of the late 2010s, a pace well above the previous two decades.
In this Chicago Fed Letter, we examine the extent to which local minimum wage hikes contributed to the acceleration of wage growth among low-wage workers. We find that minimum wage hikes led to, on average, an additional 0.5 to 0.6 percentage points per year in real hourly wage growth for workers at the bottom quartile of the wage distribution between 2015 and 2019. Bottom-quartile real wage growth grew from about 4% in 2014, when a new round of local minimum wage legislation began, to 6% to 6.5% per year shortly thereafter. Therefore, we estimate that minimum wage policy could account for about one-quarter of this improvement. Finally, we estimate that minimum wage activity translates to an additional 0.1 percentage points per year in aggregate wage growth between 2015 and 2019. We also discuss how these minimum wage effects primarily affected workers in service occupations.
It is important to emphasize that our analysis is carried out for the period prior to the onset of the coronavirus (Covid-19) outbreak. The unfolding health crisis and the stay-at-home measures taken to contain its spread have caused havoc in the labor market and the entire economy. The negative impact will likely be disproportionately borne by workers in lower-wage occupations, including many services categorized as nonessential and requiring tasks that cannot be done from home.
Median real wage growth and real minimum wage growth
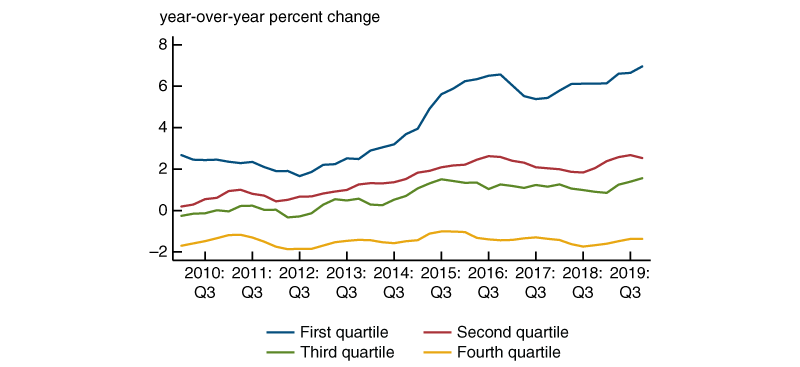
We begin by reviewing trends in real wage growth and minimum wage growth between 2010 and 2019. We calculate wage growth using the U.S Bureau of Labor Statistics’ Current Population Survey (CPS).1 Each CPS respondent reports wages at two points in time, one year apart. Figure 1 plots the median of this year-over-year hourly wage growth, deflated by the core Personal Consumption Expenditure Price Index (PCE), separately by quartiles of the hourly wage distribution. Our focus is on the lowest-earning bottom quartile.
1. Median real hourly wage growth, by wage quartile

Source: Authors’ calculations based on data from the U.S. Bureau of Labor Statistics, Current Population Survey.
Median real wage growth was stable across wage quartiles in the years immediately after the financial crisis, growing at a 2% pace for bottom-quartile earners (blue line), just above 0% for the two middle quartiles, and –1.5% or so for top-quartile earners (orange line). Starting in late 2012, real wage growth accelerated for all but the top quartile of earners but particularly for the bottom quartile. By 2015, bottom-quartile real wage growth reached 6% per year and remained at least at that pace through 2019. By comparison, real wage growth for second- (red line) and third- (green line) quartile workers stabilized at 1.5% to 2.5% per year.
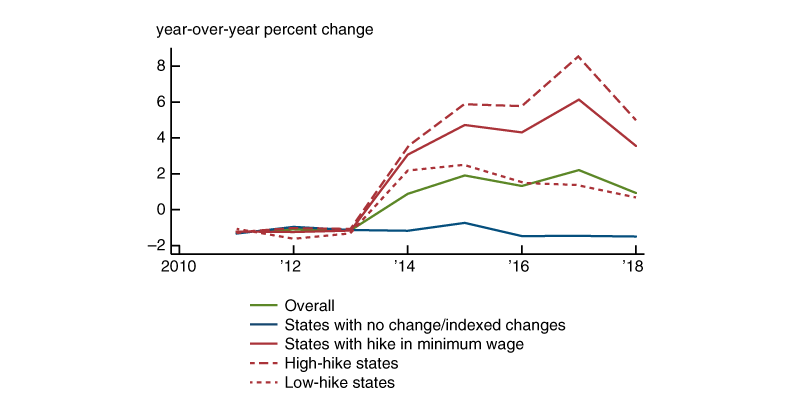
Figure 2 shows the population-weighted year-over-year aggregate growth rate in the real minimum wage since 2010 (green line).2 With virtually no changes to minimum wage policy between 2010 and 2013, the real minimum wage fell roughly by the pace of inflation. Since states and localities initiated new legislative efforts in 2014, the population-weighted real minimum wage has been growing by roughly 2% per year.
2. Population-weighted real growth in the minimum wage

However, since this flurry of activity has been entirely at the local level, there has been significant spatial heterogeneity in its magnitude. The blue line shows the real minimum wage growth rate for 26 states that either have not changed their minimum wage level since 2009 or index their rate to inflation. We refer to this group as “no-hike states.”3 The remaining 24 states and Washington, DC, we designate as “hike states.”4 Real minimum wage growth among hike states grew by 4% to 6% per year between 2014 and 2019 (solid red line). We further divide the hike states into 13 “high-hike” and 12 “low-hike” states to illustrate that much of the growth in the real minimum wage is occurring in a small handful of places.5
Impact of minimum wage hikes on bottom-quartile real wage growth
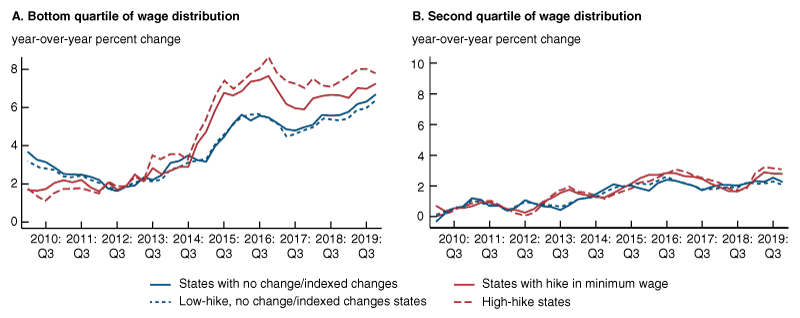
Together, figures 1 and 2 suggest that 2014 to 2019 corresponds to a period with a notable pickup in both minimum wage activity and real wage growth at the bottom of the wage distribution. To quantify this relationship more carefully, we start by comparing bottom-quartile median real wage growth in hike and no-hike states. However, there might be factors, such as differences in economic conditions, that simultaneously affect wage growth and drive passage of minimum wage legislation. To eliminate some of these confounding factors, we further compare second-quartile real wage growth between hike and no-hike states. By then sorting bottom- and second-quartile wage growth by hike status, we wash out state-specific conditions that impact both bottom- and second-quartile wage growth. This strategy works because research suggests that the impact of the minimum wage does not reach much beyond the bottom quartile.6
Panel A of figure 3 shows bottom-quartile wage growth among hike (solid red line) and no-hike states (solid blue line). Notice there is little difference in real wage growth between hike and no-hike states between 2010 and 2013, when there was essentially no minimum wage activity. Once new hikes are passed starting in 2014, real wages grow 1 to 2 percentage points per year faster in hike states. Nevertheless, wage growth in no-hike states also picks up after 2014. This pattern suggests improving labor market conditions, compositional changes in the low-wage labor force, and other unmeasured policy changes are also having an impact on low-wage earners.7 Moreover, in panel B, wage growth at the second quartile of the wage distribution is gradually improving in time but there is little systematic difference between hike and no-hike states. The figure also shows high-hike states (dashed red line) and all other states (dashed blue line).
3. Median real wage growth by minimum wage categories

Source: Authors’ calculations based on data from the U.S. Bureau of Labor Statistics, Current Population Survey.
To arrive at our final estimate of the impact of minimum wage policy, we subtract the difference between the red and blue lines in figure 3, panel A (bottom quartile) from the difference between the red and blue lines in figure 3, panel B (second quartile). We apply this estimate to the share of bottom-quartile workers who live in hike states. Figure 4 displays the results using hike versus no-hike states (blue line) and high-hike versus all other states (red line). As expected, the estimated impact of minimum wage policy is near zero through mid-2014 and then picks up thereafter. Since 2015, it has averaged 0.54 (based on hike states) to 0.62 (based on high-hike states) percentage points per year. During the same period, real wage growth accelerated from around 4% to over 6%. Therefore, we estimate that the minimum wage may be responsible for roughly one-quarter of the outsized gains in bottom-quartile wage growth between 2015 and 2019. Applying our approach to all workers irrespective of their position in the wage distribution shows that minimum wage legislation increased aggregate real hourly wage growth by roughly 0.1 percentage points per year between 2015 and 2019.
4. Estimate of impact of minimum wage on bottom-quartile real wage growth

Source: Authors’ calculations based on data from the U.S. Bureau of Labor Statistics, Current Population Survey.
By demographic group
In an accompanying online appendix,8 we also show how these results vary by age, gender, education, or occupation. Recent minimum wage hikes appear to have been especially helpful to the wage gains of women, those with less education, and younger (aged 16–24) and older (aged 55–64) workers.
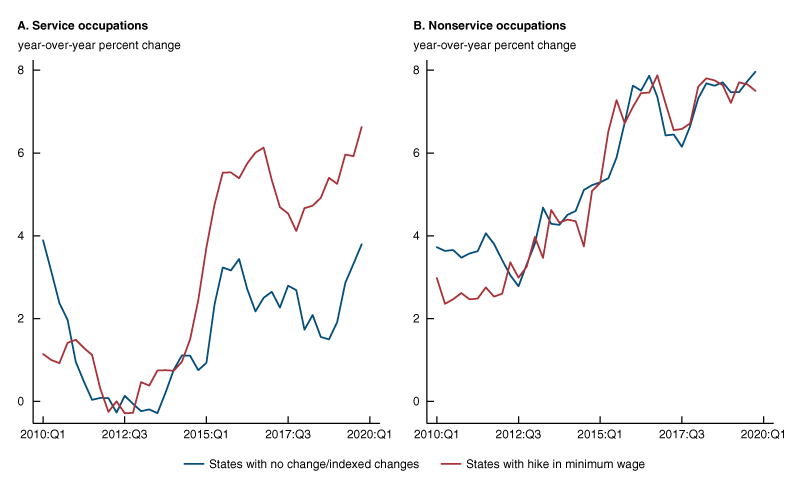
The particularly striking result is by occupation, which we highlight in figure 5. We split low-wage workers into two broad occupation groups—service and nonservice—based on their initial CPS wage observation. We find that almost all of the estimated impact of the minimum wage occurs in service occupations. Since 2014, the wage growth of service workers in the hike states has been, on average, 2.4 percentage points higher than for those in the no-hike states. In fact, until very recently, there had been no cyclical improvement in the wage growth of low-wage workers in service occupations in states with no minimum wage hikes. By stark contrast, the pace of wage growth of low-wage workers in nonservice occupations was nearly identical, and improving through 2019, in both hike and no-hike states.
5. Bottom-quartile median real wage growth, by occupation

Source: Authors’ calculations based on data from the U.S. Bureau of Labor Statistics, Current Population Survey.
It is hard to know why minimum wage policy appears to have had such different effects across occupations. Differences in the demand for skills could make minimum wage hikes binding in services but not in other occupations. In ongoing research, we have argued that the increased labor costs associated with a minimum wage hike cause firms to shift jobs away from routine tasks toward interpersonal tasks.9 As much as this channel is more or less possible across occupations, it could also affect how much hikes matter, as redistribution of tasks should also impact wage growth through selection or higher productivity. That said, we find little evidence that an index of human capital (i.e., education and experience) of low-wage workers has been statistically different by hike and no-hike states over the recent expansion.10
Conclusion
Prior to the Covid-19 pandemic, wage growth was unusually strong among low-wage workers. Naturally, tight labor markets was a key factor. We show that the minimum wage also played a notable role, accounting for roughly one-quarter of the additional 2 percentage-point improvement in the pace of annual real wage growth between 2015 and 2019.
Notes
1 The CPS is a monthly survey of 60,000 occupied households in the United States. Households are in the survey for four consecutive months, out for eight months, and then re-interviewed for another four months. To compute year-over-year wage growth, we match respondents aged 16–64 in their outgoing rotation months (fourth and eighth month of participation in the CPS). We drop individuals with missing earnings information in one or both months of the survey. We also drop individuals with imputed or top-coded earnings, those earning less than $2.13 per hour, and workers in agricultural occupations.
2 For annual data on minimum wage by state and sub-state, see Kavya Vaghul and Ben Zipperer, 2019, Historical state and sub-state minimum wages, data files, version 1.2.0, available online. Annual population shares are calculated from the American Community Survey’s (ACS) one-year samples of individuals aged 16–64.
3 We group states that index minimum wage to inflation with states that have not revised their minimum wage legislation due to their identical wage growth patterns at the bottom quartile of the wage distribution.
4 The 25 hike states encompass 48% of workers in the bottom quartile of the wage distribution. Three states (Iowa, Illinois, and New Mexico) are included because of minimum wage activity in their largest cities.
5 The high-hike states have raised their nominal minimum wage by at least 34% since 2010.
6 See, for example, David H. Autor, Alan Manning, and Christopher L. Smith, 2016, “The contribution of the minimum wage to US wage inequality over three decades: A reassessment,” American Economic Journal: Applied Economics, Vol. 8, No. 1, January, pp. 58–99. Crossref
7 Large employers, such as Walmart and McDonald’s, are, of course, present in both hike and no-hike states. As much as internal labor market equity keeps wages relatively similar across locations, the minimum wage could be a factor in no-hike states too. This issue attenuates our estimate of the impact of the minimum wage. See, for example, Jonas Hjort, Xuan Li, and Heather Sarsons, 2020, “Across-country wage compression in multinationals,” National Bureau of Economic Research, working paper, No. 26788, February. Crossref
9 See Daniel Aaronson and Brian J. Phelan, 2019, “Wage shocks and the technological substitution of low‐wage jobs,” Economic Journal, Vol. 129, No. 617, January, pp. 1–34, Crossref, and Daniel Aaronson and Brian J. Phelan, 2020, “The evolution of technological substitution in low-wage labor markets,” Brookings Institution, working paper, January, available online.
10 We use a Mincer-style estimation strategy, as described in Daniel Aaronson and Daniel Sullivan, 2002, “Growth in worker quality,” Chicago Fed Letter, Federal Reserve Bank of Chicago, No. 174, February, available online, to calculate labor quality of workers in the bottom quartile of the wage distribution in hike and nonhike states. This labor quality index is a coarse measure—based on demographics, education, and work experience—that might not be able to pick up shifts in labor market preference for individuals with better interpersonal/social skills.


