

Current surveys of household inflation expectations make it challenging to identify “inflation canaries”—individuals who consistently send out early and accurate warning signals for inflation. We propose some simple changes in survey design (longer, staggered survey panels) and emphasis (focusing on changes in expectations rather than levels and highlighting particularly accurate subpopulations) that have the potential to alleviate these concerns. To demonstrate, we provide several examples using the Federal Reserve Bank of New York’s Survey of Consumer Expectations.
Historically, miners relied on canaries to provide an early warning of toxic gases. Canaries would feel the effects of these gases first, and their demise would warn the miners that they needed to get out to avoid being poisoned. In this Chicago Fed Letter, we explore the survey design challenges that affect the potential to identify inflation canaries—individuals who send out early and accurate warning signals that inflation is going up or down—in current household surveys of inflation expectations.
Inflation forecasting models typically incorporate households’ inflation expectations to help predict future inflation. In the United States, commonly used measures for this purpose include the mean or median inflation expectation among respondents to surveys run by the University of Michigan (Surveys of Consumers) and the Federal Reserve Bank of New York (Survey of Consumer Expectations). However, forecasters also very often find that these surveys are less predictive than analogous surveys of firms and professional forecasters (Verbrugge and Zaman, 2021). This point motivates our discussion of the challenges faced by researchers in finding inflation canaries from existing household surveys to help forecast inflation.
To summarize our findings, we posit that the hunt for inflation canaries is hampered by both the scale (i.e., sample size and panel length) and scope (i.e., breadth of expectations gathered) of many household surveys. For instance, our analysis of responses to the New York Fed’s Survey of Consumer Expectations (SCE) suggests that that there is a substantial learning curve that affects individuals’ forecast accuracy. Interviewing a greater number of respondents over longer, staggered time periods would provide greater capacity for assessing respondents’ potential to serve as inflation canaries, conditional on this learning curve. One way to do this is to adopt a design where individuals are in the sample for six months, out of the sample for the next six months, and then back in for an additional six months. We refer to this as a 6in-6out-6in survey design. This is similar to the 4-8-4 structure used in the Current Population Survey, sponsored jointly by the U.S. Census Bureau and the U.S. Bureau of Labor Statistics, where individuals are interviewed for four months, exit for eight months, and then return to the sample for another four months.
Our analysis also suggests that focusing on the level of inflation expected by households may not be the most informative strategy for finding inflation canaries. We find that changes in individuals’ expected level of inflation are perhaps more informative. To demonstrate, we produce a diffusion index of changes in expected inflation among individuals in the SCE as a preliminary proof of concept.
Lessons learned from “superforecasters” and other household surveys
Before diving in, it is useful to consider whether inflation canaries are likely to exist in the first place. The literature on “superforecasters” (Mellers et al., 2014; Tetlock and Gardner, 2015; Atanasov et al., 2020) indicates that there are ordinary individuals who are very good at forecasting a variety of events. This suggests that our search is not a futile one.
Still, inflation is notoriously difficult to predict, with many studies finding that core inflation (which excludes volatile movements in food and energy prices) is very close to a random walk at forecast horizons that policymakers typically care about. Or, in other words, the best forecast of core inflation one year out is often the current level of core inflation (Edge et al., 2010).1
The design features of current household surveys of inflation expectations make the search for inflation canaries even more difficult. Most household surveys ask for one-year-ahead inflation expectations, so the accuracy of any given cross section of individuals can only be assessed 12 months after the respondents are surveyed. But by that time, they have rolled out of the sample and the consistency of their forecasting insights cannot be evaluated. A switch to an extended panel survey design is necessary for researchers to evaluate potential inflation canaries by focusing on the predictions of individuals who already gave accurate inflation forecasts in previous rounds of the survey. Currently the SCE, which follows individuals for up to 12 months, comes closest to the type of panel design we described earlier.2 But from a practical perspective, the panel length of the SCE is not long enough if we want to use the signals from inflation canaries to forecast inflation. For forecasting, we need to be able to identify inflation canaries ex ante to use their ex post predictions.
This argues very strongly in favor of a survey design in which the same respondents are interviewed 12 months or more apart. Such a panel structure is ideal because it would keep respondents in the sample for some amount of time after they’ve been identified as canaries, allowing for additional forecasts to be observed. For example, existing household surveys of inflation expectations could be moved to a 6in-6out-6in structure.
A 6in-6out-6in design would still allow for overall mean and median expectations to be computed without disruption. But it would also allow for an assessment of the previous accuracy of individuals’ inflation expectations and an analysis of how and why they change over time. An analysis of this type could be of great value to economic researchers studying how inflation expectations are formed. For example, Gennaioli et al. (2024) make the case that individuals who experienced high inflation in the 1970s changed their expectations in the post-pandemic period prior to individuals who had primarily experienced low and stable inflation in their lifetimes. A 6in-6out-6in structure would allow researchers to better understand why by identifying and tracking the relevant subsets of individuals over longer periods.
Several studies have pointed out that forecast accuracy across a range of outcomes is correlated across individuals (Mellers et al., 2014). This means that it may also be useful to ask respondents about their expectations on a broad range of topics. The SCE, in fact, asks respondents about a range of economic and financial variables.3 But it goes without saying that this additional information is not a substitute for longer histories from a diverse set of individuals. Larger sample sizes increase the universe in which to search for canaries. Indeed, some increase in sample size would likely even be necessary to address possible sample attrition in moving to a 6in-6out-6in panel.
The survey design problem is only magnified if we wish to either oversample subsets of the population or gradually introduce individuals into the sampling frame after a review period. This last point turns out to be an important one for the SCE. Figure 1 shows the average absolute forecast error between respondents’ one-year inflation expectations and core CPI (Consumer Price Index) inflation over the 12 months after they make their forecast, grouped by how many months respondents have been in the SCE sample. Individuals appear to get better at forecasting inflation with a little practice: The average forecast error declines sharply over the first two months and then stabilizes by month three.4
1. Average absolute forecast error between SCE respondents’ expectations and actual inflation
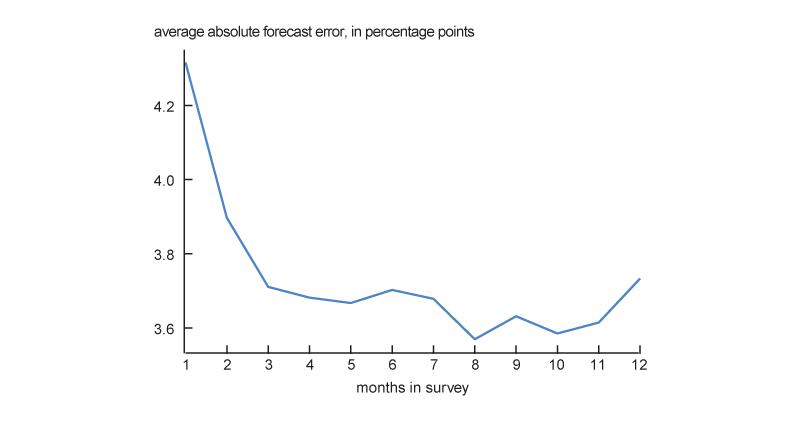
Source: Authors’ calculations based on data from the Federal Reserve Bank of New York, Survey of Consumer Expectations.
Figure 1 thus points to a peculiar feature of household inflation expectations and has important implications for survey design. The initial decline in forecast error in figure 1 suggests that survey respondents learn over time, perhaps because being in the survey induces them to pay more attention to inflation or perhaps because they better understand the survey questions. This learning curve is another reason a 6in-6out-6in panel survey structure for household inflation expectations might be useful.
For example, one question raised by figure 1 is whether people whose past forecasts were relatively accurate got lucky or if they are truly canaries and have consistently accurate inflation expectations. With the limited sample scope of the SCE, we can offer only modest evidence in favor of consistency. Specifically, absolute inflation forecast errors for individuals are moderately correlated and stable over time beyond a respondent’s second month in the sample, as seen in figure 2.
2. Correlation between SCE respondents’ absolute forecast error in third survey month and absolute error in each subsequent month
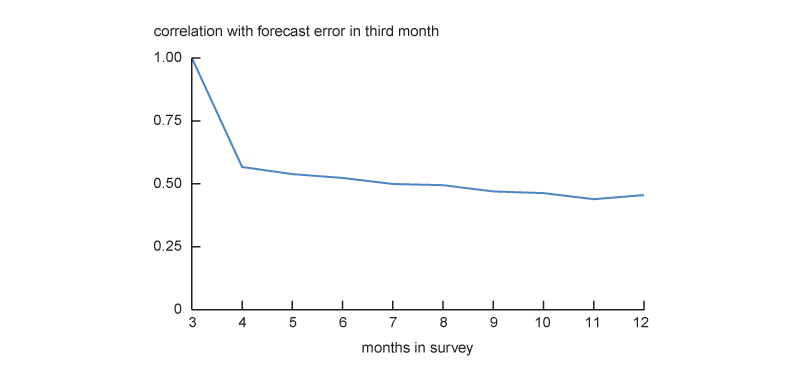
Source: Authors’ calculations based on data from the Federal Reserve Bank of New York, Survey of Consumer Expectations.
But in a 6in-6out-6in survey design, the first six-month wave could be viewed as a training sample and the second six-month wave (after a break of six months) as an evaluation sample. Six-month waves would offer plenty of time for any learning curve to apply, and the six-month separation between waves provides enough time to have passed to begin evaluating respondents’ initial 12-month inflation expectations. And in both six-month waves, there is still enough leeway to potentially drop the initial months’ results if necessary.5
A preliminary search for inflation canaries
Despite the challenges raised above, we try to find inflation canaries in the SCE. This exploration provides a proof of concept to illustrate the approach that could be taken if longer, more extensive panel data on household inflation expectations were to become available. We conclude that this approach shows some potential.
We begin by recognizing the fact that there is a lot of variation in the average level of expected inflation across households. This is clear in figure 3, which shows various percentiles of respondents’ average one-year inflation expectations across all the months that they appear in the SCE. There is considerable variation across households, both when recent inflation (shown in red as core CPI inflation over the preceding 12 months) has been high and when it has been low.6
3. SCE respondents’ inflation expectations, by percentile
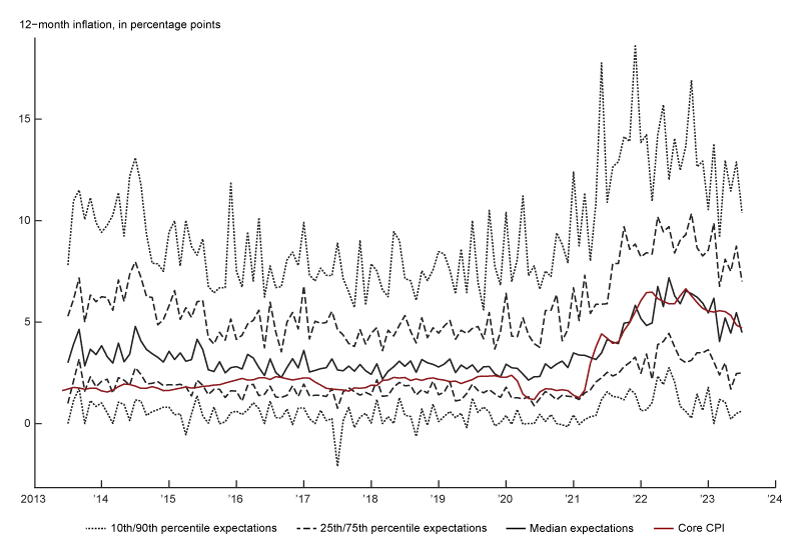
Source: Authors’ calculations based on data from the Federal Reserve Bank of New York, Survey of Consumer Expectations.
Useful inflation canaries are those that consistently change their expectations in advance of changes in the direction of inflation. For this reason, we focus on changes in inflation expectations, which remove the very prominent household-level fixed effects evident in figure 3. Figure 4 plots percentiles of the distribution of one-month changes in 12-month ahead inflation expectations. We also include in figure 4 the one-month change in realized 12-month core inflation for the relevant survey month in red for comparison and consistency with figure 3.
4. SCE respondents’ changes in inflation expectations, by percentile
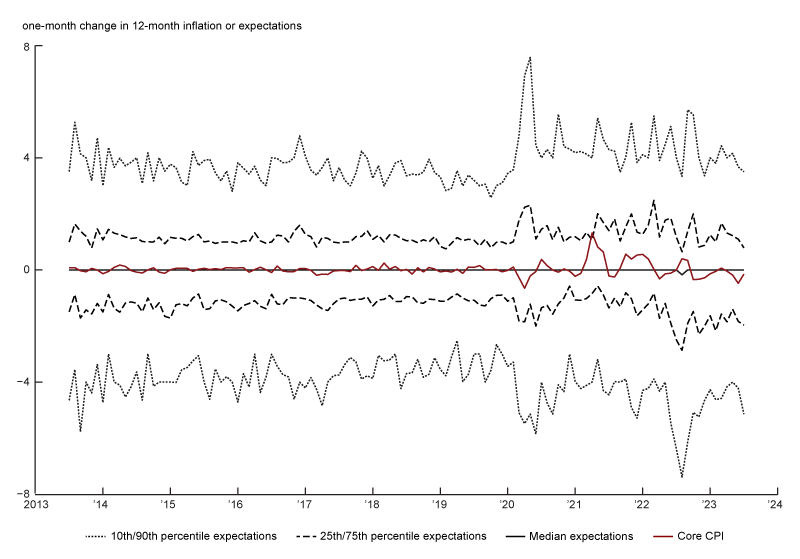
Source: Authors’ calculations based on data from the Federal Reserve Bank of New York, Survey of Consumer Expectations.
A number of things are apparent from figure 4. First, over much of the period since 2013 (when the SCE began), actual inflation was pretty stable, so even very good canaries wouldn’t have been expected to change their tune very much during this period. And indeed, during this period we see that a large fraction of respondents appear to change their inflation expectations very little.
However, even after 2020 when inflation changed considerably, the median respondent shows little change in their expectation for future inflation. This happens because there are large portions of the sample that are changing their expectations in both directions, effectively canceling each other out. Ideally, we would like to find a subset of respondents of the SCE sample whose inflation expectations were relatively accurate in the past. We could then use movements of more of those individuals’ expectations in one direction rather than another as a potential early warning sign for changes in inflation.
Figure 5 shows a diffusion index that we developed using only the survey responses of individuals whose one-year inflation expectations ended up being within plus or minus 2 percentage points of actual inflation over the relevant 12-month period. In the SCE this is an ex post selection because we can only evaluate this after respondents7 with the most accurate inflation expectation have rolled out of the sample. For this subsample with the most accurate inflation expectations in the SCE, we calculate an index where the value in each period is the percentage point difference between the share of these households whose inflation expectations increased and the share for whom they declined, normalized so that a value of 100 indicates these shares are equal. In essence, figure 5 shows an example of a diffusion index tracking a subset of the most accurate inflation forecasters, in this case defined as individuals with absolute forecast errors of 2 percentage points or less. The diffusion index slightly leads the published one-year median at key inflection points for 12-month inflation, including the initial Covid-era run-up in inflation in early 2021, as well as the peak and subsequent decline after the summer of 2022. This is a promising result that shows that having a general sense of who the most accurate inflation forecasters are and focusing on the changes in their expectations could provide a valuable signal of future inflation. Importantly, this proof of concept assesses the accuracy of respondents after the fact. That is, we used information not available in the month for which the inflation expectations are measured.
5. Diffusion index for SCE respondents with absolute forecast error ≤2 percentage points
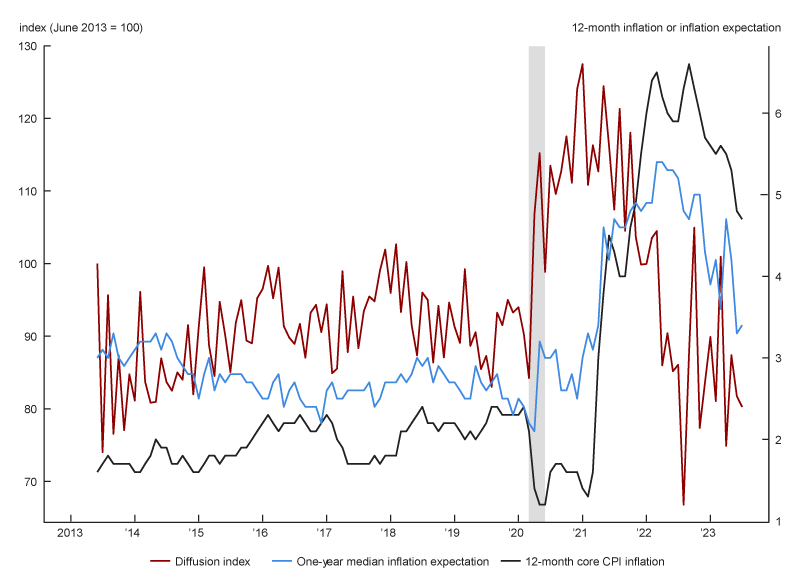
Source: Authors’ calculations based on data from the Federal Reserve Bank of New York, Survey of Consumer Expectations.
If respondents were in the sample for more than 12 months, then the observations from a year ago or longer would allow us to assess their accuracy in real time using an ex ante classification of respondents’ forecast accuracy. This is the key idea that motivates our recommendation that household surveys of inflation expectations adopt something like a 6in-6out-6in sampling structure. This structure would give analysts the ability to identify the most accurate inflation forecasters while they are still in the sample, allowing them to follow this subgroup in real time as they continue to update expectations.8
In addition, while the diffusion index in figure 5 is highly stylized, the accuracy threshold we set for inclusion in the index of plus or minus 2 percentage points of actual inflation is quite modest. For example, if 12-month inflation a year from now were exactly 2%, our diffusion index would include everyone today whose expectations ranged from 0% to 4%—a very large range, containing very different implications for inflation. It is possible that the 6in-6out-6in sampling design would allow for a subgroup with even greater ex post accuracy to be identified. And of course, a larger sample size would greatly help in the search for these individuals.
Conclusion
Identifying inflation canaries, or people who reliably signal a change in inflation via their expectations, is not an easy task. Current household surveys of inflation expectations are not designed for this. To do this well, one would need samples that are both larger in scale and broader in scope than existing surveys.
In particular, to properly identify inflation canaries, a long panel of responses is necessary so that one could compare multiple assessments of inflation expectations for a given individual to realized inflation. While it is standard to ask individuals more than once to predict inflation over the next 12 months, current survey panels are still too short to effectively use the insights from individuals with accurate expectations in forecasting, because individuals are out of the sample by the time the accuracy of their predictions can be checked. In addition, respondents appear to take several months to learn how to properly answer questions about inflation expectations.
Interviewing a greater number of respondents over longer, staggered time periods—for example, using a 6in-6out-6in sample design—would greatly increase the potential to identify inflation canaries. Our analysis suggests that this change in survey design, combined with focusing on changes in expectations rather than levels, is a promising path forward in the search for inflation canaries. Larger and longer surveys would naturally be more expensive, but given the potential of these investments to improve inflation forecasts, they seem worthy of exploration.
Notes
1 The success of monetary policy in producing relatively stable inflation from the mid-1980s until 2020 is often cited as a potential reason for why inflation is so hard to predict (McLeay and Tenreyro, 2018).
2 In the University of Michigan’s Surveys of Consumers, respondents are typically interviewed only twice—with the second interview generally occurring six months after the first.
3 The University of Michigan’s Surveys of Consumers, by contrast, focus on respondents’ expectations about inflation, gas prices, and labor market conditions.
4 Note that this pattern is not due to people who make inaccurate forecasts leaving the sample. The same pattern is observed when respondents are required to be in the sample for all 12 months.
5 Of course, one would need to evaluate whether the learning from the first six months would persist after a break of six months.
6 Even in the early 2010s, when inflation was consistently around 2%, the difference between the 10th and 90th percentile of individuals’ mean inflation expectations was roughly 7 percentage points!
7 In this example, respondents were allowed to drop in/out of the diffusion index depending on whether their absolute forecast error in a given month fell under the 2% threshold.
8 Even if you assume a two- to three-month learning curve exists, as suggested by figure 1, an analyst could simply evaluate respondents’ forecast accuracy based on months three and/or four of their first survey stint. Given that the expectations are for 12-month inflation, the analyst would be able to make these accuracy determinations by months three and/or four of the respondents’ second survey stint, at which time the respondents would still have two to three months left in the survey for their expectations to be followed.


