In this article, we present a new real-time model called CHURN—short for Chicago Fed Unemployment Rate Nowcast. CHURN provides a weekly tracking estimate for the civilian unemployment rate (UR) produced by the U.S. Bureau of Labor Statistics (BLS). To do so, CHURN blends monthly statistics on job flows (i.e., job-finding and job-separation rates) from the BLS and other traditional labor market indicators with alternative high-frequency indicators from private sector sources.
We begin by highlighting the advantages of blending alternative and traditional data on job flows to predict the official U.S. civilian unemployment rate. The CHURN model is designed to efficiently combine these data into a single measure—a model-implied flow-consistent unemployment rate (FCR)—that can be used to forecast the official unemployment rate. We then demonstrate the value of this approach by comparing CHURN’s predictive accuracy with that of two other commonly cited unemployment rate forecasts. Finally, we close by showing how CHURN can be used as a real-time weekly tracker for unemployment.
Why do we blend alternative and traditional data on job flows to predict unemployment?
The U.S. civilian unemployment rate reported monthly by the BLS in its Employment Situation report is derived from the Current Population Survey (CPS).1 Survey results correspond to a particular (reference) week of each month, providing a snapshot of unemployment at a particular point in time.2 This construction can overemphasize temporary labor market disruptions (e.g., strikes, lockdowns, or extreme weather events) during the reference week.
Alternative high-frequency labor market data have been invaluable in instances when a temporary labor market disruption occurs in a reference week. For example, data from Google Trends proved to be quite useful during the Covid-19 pandemic (Aaronson et al., 2022). However, it remains an open question as to how helpful these alternative data are more generally for predicting unemployment.
With CHURN, we show that alternative data can indeed be helpful when used to track job flows in real time. The reason is simple: The unemployment rate summarizes the net effect of job flows. This feature of the labor market is what motivates the bathtub model of unemployment (Şahin and Patterson, 2012). As flows into unemployment (job separations) rise more than those out of it (job finding), unemployment rises—analogous to the water level falling in a full bathtub with an open drain despite a running faucet.
A flow-consistent unemployment rate captures the net effect of job flows over time.3 As the job-separation rate begins to outpace the job-finding rate, both the flow-consistent and official unemployment rates tend to rise with time. There is a fair amount of this churn that takes place every month in the U.S. labor market. For this reason, the use of a flow-consistent unemployment rate to predict the official unemployment rate is commonplace (see Şahin et al., 2021).
Alternative labor market data are often highly correlated with the job-separation and job-finding rates, making them also natural inputs for our unemployment forecasting exercise. With CHURN, it is possible to blend these data with traditional labor market metrics for job flows to construct a model-based real-time FCR (i.e., a model-implied FCR) and then use it to predict the official unemployment rate.
Which alternative and traditional labor market indicators track job flows in (near) real time?
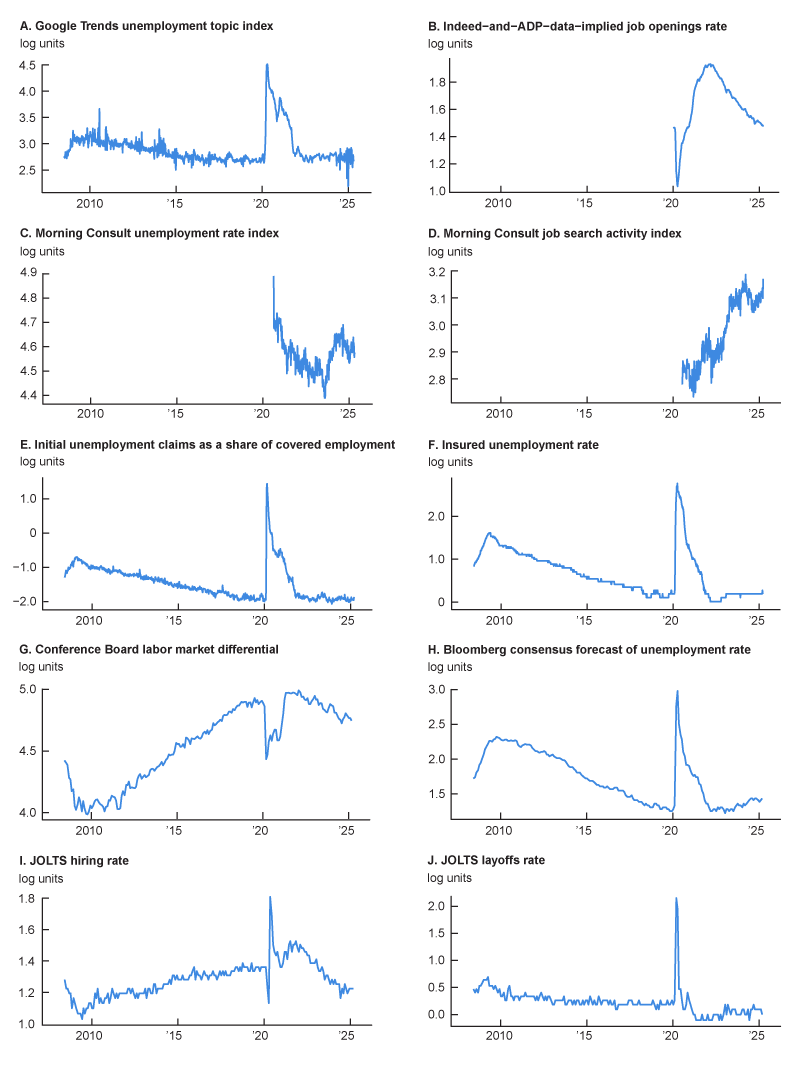
Alternative labor market data are plentiful at this point, but some correlate more strongly with job flows than others. We have identified the following measures as being particularly useful.
- Google: A seasonally adjusted4 Google Trends weekly index for the unemployment topic based on a daily sample of internet searches5 for the U.S.
- Indeed and ADP: A seasonally adjusted job openings rate calculated from Indeed’s daily measure of job postings divided by ADP’s monthly measure of private payroll employment
- Morning Consult: Seasonally adjusted weekly indexes tracking self-reported unemployment and job search activity from online surveys of U.S. adults
To enhance their signal for job flows, we then blend these alternative data sources with the following traditional labor market indicators.6
- U.S. Department of Labor: Seasonally adjusted initial unemployment insurance (UI) claims (expressed as a share of covered employment7) and the insured unemployment rate for the U.S.
- Conference Board: The labor market differential index from the Consumer Confidence Survey (jobs plentiful versus jobs hard to get)
- Bloomberg: The consensus forecast for the yet-to-be-released unemployment rate as shown on Bloomberg’s economic calendar (sourced from Investing.com)
- U.S. Bureau of Labor Statistics: The previous month’s hiring and layoff rates from the Job Openings and Labor Turnover Survey (JOLTS)8
Figure 1 plots these ten data series since July 2008, with each scaled using the log transformation. The first thing to note about the data in this figure is that not every measure is reported at the same frequency: Some are reported monthly (e.g., the Conference Board index, the Bloomberg consensus forecast, and the ADP employment data), while others are weekly (e.g., UI claims, the Google Trends index, Indeed job postings data, and the Morning Consult indexes). To relate them to each other, we need to be mindful of their timing differences. We do so by focusing on only the values of these series that are observed (for weekly data) or known (for monthly data) during reference weeks for the official unemployment rate.
1. Labor market indicators in CHURN
Sources: Authors’ calculations based on data from Bloomberg (via Investing.com), Google, Indeed, Morning Consult, and Haver Analytics.
To blend the information in these indicators with the job-finding and job-separation rates derived from the CPS,9 we rely on a statistical method called partial least squares (PLS).10 PLS is designed to produce targeted linear combinations of a set of predictors (call them X) that maximize their covariance with a set of outcomes (call them Y). With CHURN, we include in Y the job-separation and job-finding rates derived from the CPS and in X the set of traditional and alternative labor market indicators from government agency and private sector sources in figure 1. Using PLS, we then construct the CHURN model’s implied job-separation, job-finding, and flow-consistent unemployment rates.
Why do we construct a model-implied flow-consistent unemployment rate?
Others have demonstrated the value of using the bathtub model of unemployment and the FCR to predict the unemployment rate.11 Our contribution with CHURN is to provide a novel way to both fill in the gaps in the job-finding and job-separation rates caused by reporting lags and remove potential measurement error in them that can cloud the unemployment rate forecasts by blending these two job flow rates with alternative labor market data.12
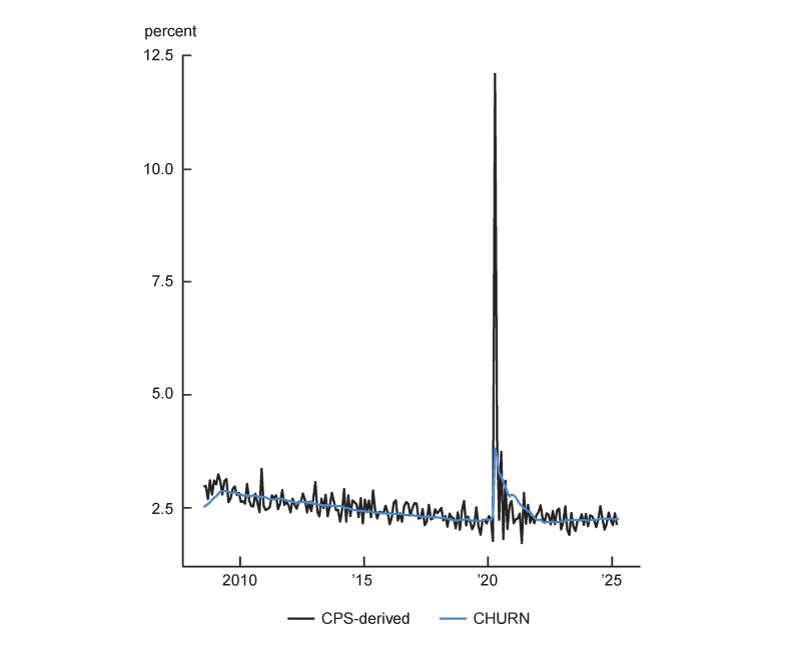
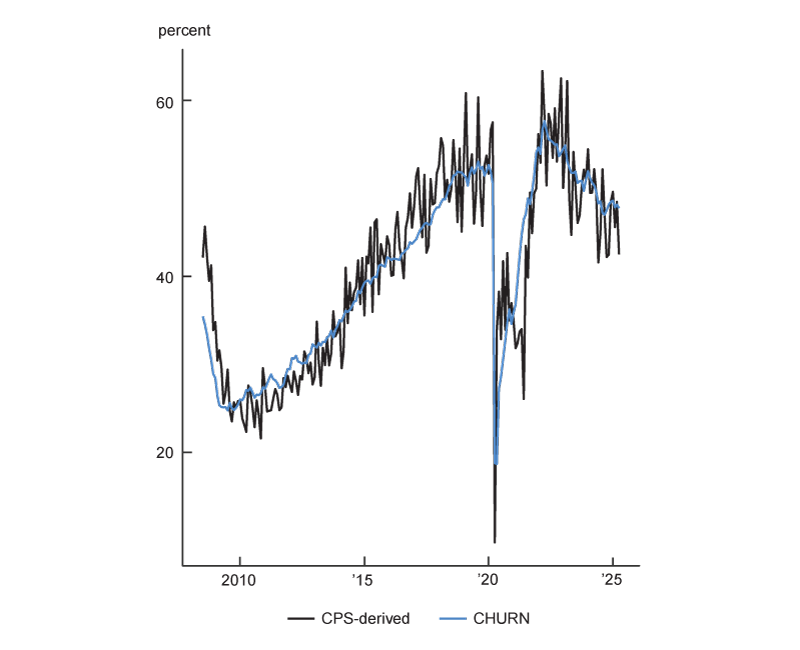
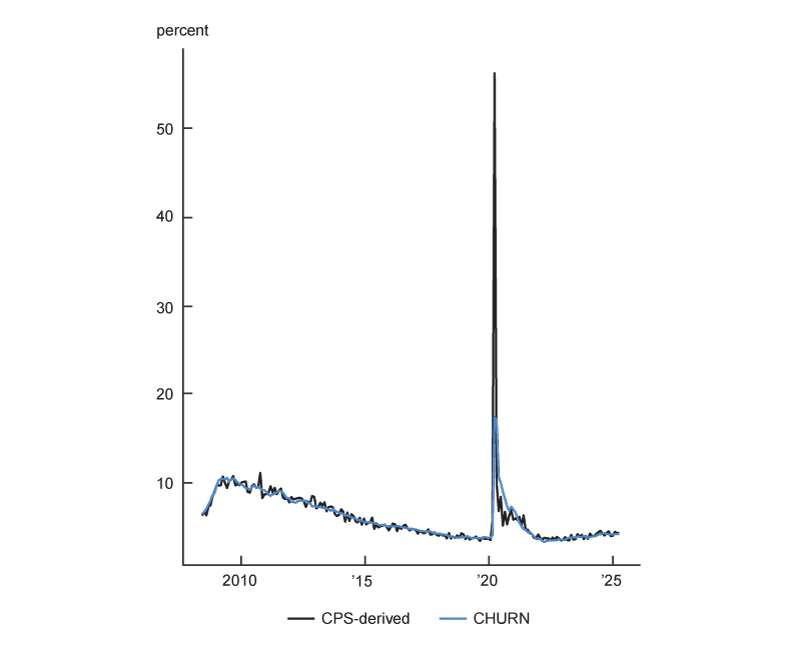
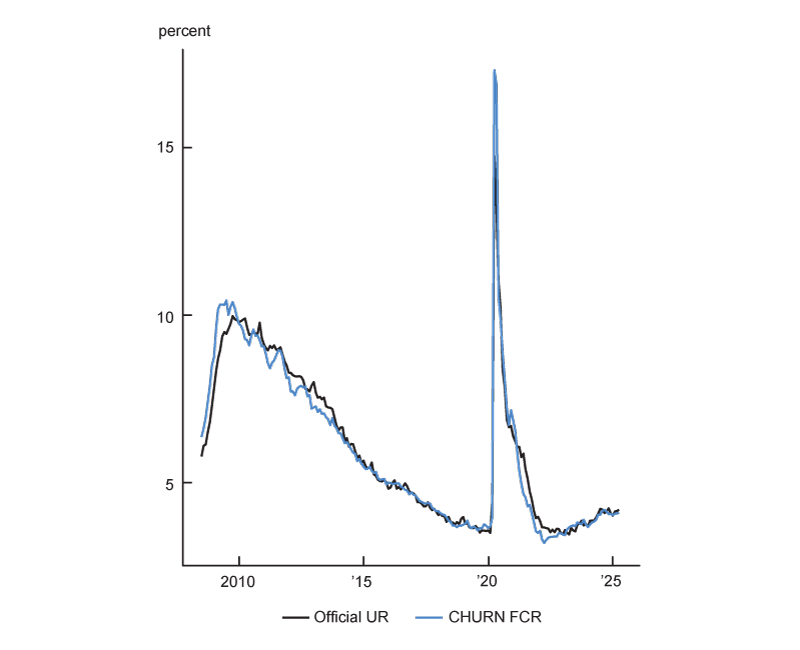
To demonstrate this novel contribution from CHURN, figure 2 plots the time series of our model-implied FCR and its underlying components relative to their counterparts derived solely from the CPS data. Our PLS estimates track closely with both CPS-derived job flow rates (see panels A and B of figure 2). When we then use these estimates to construct a model-implied FCR, it also tracks quite well with its CPS-derived variant. However, our CHURN estimates of the job-finding, job-separation, and flow-consistent unemployment rates are all considerably smoother, which is a byproduct of blending the CPS data with other measures of job flows.
2. The flow-consistent unemployment rate and its underlying components
A. Job-separation rate
B. Job-finding rate
C. Flow-consistent unemployment rate
D. Unemployment rate
Sources: Authors’ calculations based on data from Bloomberg (via Investing.com), Google, Indeed, Morning Consult, and Haver Analytics.
This smoothing feature of our CHURN estimates in figure 2 motivates the use of our model to nowcast the official unemployment rate ahead of each month’s release. To further demonstrate CHURN’s usefulness, figure 2 also plots the time series for the official unemployment rate. It, too, exhibits a high degree of correlation with our model-implied FCR, with a correlation coefficient of 0.98 in levels and 0.94 in first differences.13
How do we predict the official unemployment rate?
To predict the yet-to-be-released value for the official unemployment rate with our model-implied FCR, we use Bayesian estimation methods to bring in external (prior, or a priori) information that is not contained in the short sample history of BLS reference weeks used for estimation. In particular, the average monthly change in the unemployment rate over extended periods of time is close to zero despite the volatility that occurs around recessions. We account for this by predicting the change in the unemployment rate in our Bayesian linear regression model14 centered around a no-change prior.
Our Bayesian linear regression, thus, relates the reference-week-to-reference-week changes in both the official unemployment rate and our model-implied FCR with a prior that acts to shrink the regression coefficients toward zero. In the limit, when our prior beliefs exactly hold, this model would predict no change in the unemployment rate. However, instead of imposing this exact relationship, we estimate the strength of this a priori belief balanced against the strength of the observed relationship in our sample between these two measures to form an a posteriori prediction.15
How does CHURN compare historically with other forecasts of unemployment?
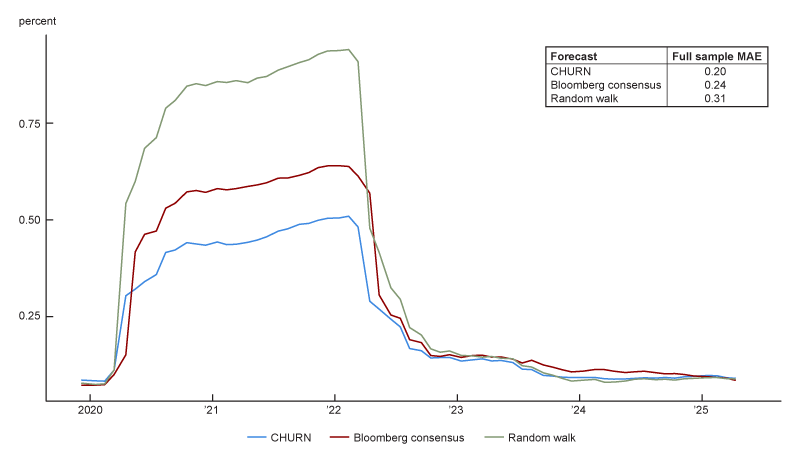
We backtest CHURN’s real-time forecast accuracy by iteratively predicting out-of-sample unemployment rate values from January 2018 through April 2025.16 To judge CHURN’s forecasting performance, we then compute these values’ mean absolute error, or MAE, and compare it with that obtained using the Bloomberg consensus forecast and a random walk forecast embodying our no-change prior. Lower MAE values correspond to higher accuracy measured in percentage points of the unemployment rate.
Over the full time period (January 2018–April 2025), CHURN performs quite well at nowcasting the unemployment rate, with an MAE of 0.20, versus 0.24 for the Bloomberg consensus forecast and 0.31 for the random walk forecast.17 To show how the performances of CHURN and the other two forecasts have varied over time, figure 3 plots MAE values for all three based on 24-month moving averages of the forecast errors. CHURN outperforms or matches the accuracy of both the Bloomberg consensus and random walk forecasts for all but a few months of the period covered in figure 3, with larger gains in accuracy during times when the unemployment rate was changing quickly (e.g., in 2020).
3. Out-of-sample performance of unemployment rate nowcasts
Sources: Authors’ calculations based on data from Bloomberg (via Investing.com), Google, Indeed, Morning Consult, and Haver Analytics.
How can CHURN be used as a weekly tracker for job flows and unemployment?
Assuming that the relationship between our model-implied FCR and the official unemployment rate is stable over time, we can translate our model nowcasts to any week of the month, in essence predicting with CHURN what the official unemployment rate might have been during nonreference weeks by gradually incorporating into CHURN any new information revealed in each week. Not only that, but with CHURN we can also assess the uncertainty around these estimates, constructing finite-sample prediction intervals that are calibrated to achieve a specified coverage rate.18
Figure 4 highlights three recent episodes where the CHURN nowcast differed significantly from the Bloomberg consensus forecast of unemployment. To define what it means to differ significantly, we identify instances where the Bloomberg consensus forecast for a particular month fell outside or within 1.5 basis points of the limits of a 68% prediction interval for the CHURN nowcast. This means that the Bloomberg consensus forecast fell in a region that we would expect the yet-to-be-released unemployment rate value to fall only about 32% of the time based on the CHURN model.
4. CHURN weekly tracking examples for the unemployment rate
A. May 2022

B. January 2023

C. December 2023

Sources: Authors’ calculations based on data from Bloomberg (via Investing.com), Google, Indeed, Morning Consult, and Haver Analytics.
We view these episodes as showing instances where our blend of traditional and alternative labor market data provides unique information on the state of unemployment in the U.S. To further highlight this point, we show the full weekly tracking of estimates for the unemployment rate in each episode. In two of these episodes the actual unemployment rate came in closer to the CHURN nowcast than the Bloomberg consensus forecast, and CHURN weekly tracking was heading in the same direction as the actual unemployment rate early on in most of these episodes (see panels A and B of figure 4).
Conclusion
CHURN represents for us a promising first step toward the integration of alternative labor market indicators into a nowcasting model for the unemployment rate. We plan to monitor CHURN’s performance and will consider publishing its results in the future. The most recent CHURN estimates, as of June 5, 2025, are available online.
Notes
1 The unemployment rate is the ratio of the number of unemployed persons to the number of persons in the labor force for those aged 16 and older:
2 The reference week is typically the week containing the 12th day of each month.
3 The flow-consistent unemployment rate is defined as the job-separation rate divided by the sum of the job-separation and job-finding rates . This definition is what is used later to construct the CPS-derived FCR and model-implied FCR. For the former, we use CPS data to calculate the job-separation () and job-finding () rates. See note 9 for further details. For the latter, we instead use the CHURN model estimates of both rates.
4 The Google Trends unemployment topic index series (in panel A of figure 1) was seasonally adjusted by us with the Prophet tool developed by Facebook’s data scientists for the seasonal adjustment of high-frequency data.
5 We use the Eichenauer et al. (2022) method to construct a daily topic index using the trendecon package in the R programming language.
6 See Brave et al. (2022) for additional examples of blending traditional and alternative data sources.
7 This construction adjusts for changes over time in UI eligibility. Covered employment simply means the employment of workers who would be eligible for UI (i.e., those who are covered by UI) if they were laid off from their jobs.
8 The JOLTS hiring rate is the number of hires during the entire month as a percentage of total employment. The JOLTS layoff rate is the total number of layoffs and discharges during the entire month as a percentage of total employment.
9 We use the Shimer (2005) method to construct CPS-derived job-finding and job-separation rates (as discussed in note 3). The job-finding rate is calculated as where is the unemployment level and is the number of newly unemployed workers during the period. The job-separation rate is calculated by setting the following mathematical expression to equal 0 and solving for where is the unemployment rate as defined in note 1 (and is Euler’s number, a constant).
10 We use the Bioconductor package ropls in the R programming language to estimate the PLS model with the assumption of two common components.
11 See, for instance, this example from Oxford Economics and the work of Barnichon and Nekarda (2012).
12 The job-separation and job-finding rates follow the same reporting structure as the official unemployment rate.
13 The three-month moving average of the CPS-derived FCR (see note 3) or its underlying components is often used instead to smooth through the noise in the monthly data. Our model-implied FCR has a correlation coefficient of 0.92 in levels and 0.68 in first differences with the three-month moving average of the CPS-derived FCR over the period covered in figure 2.
14 Linear regressions are statistical processes that measure the degree of correlation between two variables (a predictor variable and a response variable). The estimated coefficients from these regressions show the degree of correlation.
15 We use the rstanarm package in the R programming language for this purpose with an informative Lewandowski–Kurowicka–Joe (LKJ) prior that centers the regression R-squared value at 0.015.
16 To allow for a sufficient sample history for the PLS model to evaluate, we exclude the Morning Consult indexes and the Indeed-and-ADP-data-implied measure from the out-of-sample CHURN nowcasts for the unemployment rate until January 2021.
17 It is important to note, however, that we use revised data and current seasonal factors in our model predictions. The Bloomberg consensus forecast’s predictions were made using unrevised data and any seasonal factors available at the time. Of the data series that we include in CHURN, data revisions are primarily a concern for the UI claims and JOLTS data. Given the timing of the real-time data flow, in most instances the revised UI claims data would have been available for a hypothetical CHURN nowcast made just prior to the BLS Employment Situation report release. However, during the Covid-19 pandemic there were also often changes made to the seasonal factors for UI claims that our out-of-sample testing procedure does not capture. For JOLTS, our use of revised data is more informative than what a forecaster in the Bloomberg consensus forecast would have had available to them. That said, our out-of-sample testing without the use of JOLTS data was found to produce comparable results.
18 We use the conformalbayes package in the R programming language for this purpose. It applies a leave-one-out cross-validation procedure to estimate a correction factor for the credible sets produced by our Bayesian linear regression.


