

In this article, I estimate that 80% of the population of the five states of the Seventh Federal Reserve District lives in a county that trailed the nation’s cumulative growth in real gross domestic product (GDP) and employment from near the start of the twenty-first century through 2023. Further analysis of counties’ relative economic performance suggests that the Seventh District states are unique: They have elevated shares of people living in counties that trail the nation in real GDP and employment growth; they experience more lackluster growth; and their underperforming counties experience more sluggish population and median household income growth than those outside District states.1 The prevalence of economic underperformance in the Seventh District states and its unique features suggest that local conditions may be important for understanding these counties’ economic outcomes.
Since the late 1990s, U.S. counties have diverged in their per capita incomes, with the income gap between rich and poor places increasing over this period (Ganong and Shoag, 2017; Manduca, 2019; Gaubert et al., 2021; and U.S. Department of Commerce, 2023). This divergence is a reversal of the post-World War II trend of poorer places growing more rapidly to “catch up” to richer places (Barro and Sala-i-Martin, 1991; and Blanchard and Katz, 1992). The rise in economic differences across regions is a result of the richest places pulling ahead of other regions and outperforming them by a widening margin over time (Manduca, 2019; and U.S. Department of Commerce, 2023). With that said, it is less clear how aggregate measures of local economic activity, such as county-level GDP or employment, have evolved alongside the divergence in per capita incomes by region. Because boosting output, employment, or population in places is often a goal for policymakers, particularly as a means of raising per capita incomes and improving living standards more broadly, I more closely examine aggregate measures of local economic activity in this article (see the appendix for details on the data sources).
Specifically, I analyze counties’ relative performance in their real GDP growth over the 2001–23 period and employment growth over the 2000–23 period, with a spotlight on the counties in the five states of the Chicago Fed’s Seventh District (Illinois, Indiana, Iowa, Michigan, and Wisconsin). In this article, I define economic underperformance in a county as trailing the nation’s cumulative growth in both real GDP and employment over the specified periods. Notably, underperforming counties are not randomly located across the U.S. and instead cover large swathes of the Chicago Fed’s Seventh District states, New England, and the Mid-Atlantic, as well as some parts of the South. Strikingly, 80% of the population of Illinois, Indiana, Iowa, Michigan, and Wisconsin—or roughly 31.3 million people—lives in a county that trailed the nation in terms of both real GDP and employment growth. Nationally, 46% of the population lives in a county that underperforms (see figure 1 in the next section).
By more closely examining underperforming counties, I explore how residents of these places are experiencing lackluster local economic growth. Notably, these counties generally experienced positive economic growth from the early 2000s through 2023; that is, their economies were not shrinking during that span. However, the pace of growth, as measured by real GDP or employment, was more sluggish than in other places, and underperforming counties in Seventh District states fared relatively worse than underperforming counties located elsewhere. The relatively worse performance of counties in Seventh District states may point to a unique role for local conditions, including local economic factors.
Considering the divergent economic trajectories of counties may be useful for understanding where monetary policy transmission may depend on local structural factors (Hauptmeier et al., 2020; and McKay and Wolf, 2023). Research finds that regions differ in their sensitivity to monetary policy owing in part to their industry mix, businesses’ access to capital, and households’ exposure to variable-rate mortgages (Carlino and DeFina, 1998; Fratantoni and Schuh, 2003; Owyang and Wall, 2009; Beraja et al., 2019; and Bellifemine et al., 2023). However, evidence is more mixed on whether poorer or slower-growing regions are more or less sensitive to monetary policy, as well as how persistent its effects are in them (Hauptmeier et al., 2020; and Herreño and Pedemonte, 2022). The analysis in this article also offers an alternative approach that looks beyond per capita measures to identify economically struggling places, which may be targets for place-based policies (Austin et al., 2018; Nunn et al., 2018; and Gaubert et al., 2025). Finally, this article highlights the regional economic context shaping the work of local economic development officials and practitioners.
Many people in Seventh District states live in counties where economic growth did not keep pace with the nation’s
Between 2001 and 2023, U.S. real GDP increased a cumulative 59.3%; and between 2000 and 2023, national employment grew 19.3%. However, as many have recognized, places across the U.S. did not uniformly experience these growth rates. Indeed, 46% of the U.S. population lives in a county that underperformed the nation in both real GDP and employment growth over these periods (figure 1). In the Seventh District states, that share is at a much higher 80% partly because of relatively sluggish growth in all the Seventh District states’ most populous counties (i.e., Cook and DuPage Counties, Wayne and Oakland Counties, and Marion County, where Chicago, Detroit, and Indianapolis are located in or near, respectively) and a large majority of their other counties. The share of the population living in underperforming counties is especially high in Illinois (90%) and Michigan (88%).
1. Share of people living in counties where real gross domestic product (GDP) growth and employment growth trail the nation's growth is higher in Seventh District states
| Cumulative growth rate underperforms with respect to | |||
|---|---|---|---|
| Real GDP (2001–23) | Employment (2000–23) | Real GDP (2001–23) and employment (2000–23) | |
| (- - - - - - - - - - - - - - - - - - - - - - percent - - - - - - - - - - - - - - - - - - - - - -) | |||
| Trails nation’s growth rate | |||
| U.S. population | 57.2 | 52.5 | 45.9 |
| Seventh District states’ population | 84.8 | 84.3 | 80.3 |
| Trails 75% of nation's growth rate | |||
| U.S. population | 40.8 | 46.2 | 33.3 |
| Seventh District states’ population | 75.3 | 82.6 | 73.7 |
| Trails 50% of nation's growth rate | |||
| U.S. population | 24.3 | 37.7 | 21.5 |
| Seventh District states’ population | 52.9 | 76.4 | 54.5 |
Even among underperforming counties, people tend to live in places that are growing economically, just not as quickly as elsewhere. Nearly everyone lives in a place experiencing real GDP growth, while just over half live where employment is growing. Yet, in Illinois, Indiana, Iowa, Michigan, and Wisconsin, extremely sluggish growth is more widespread than elsewhere; slightly over half (55%) of the population lives in a county with real GDP and employment growth that is less than half the nation’s, in contrast to 22% for the country as a whole (figure 1).
Some parts of the U.S. have very low shares living in underperforming counties. According to my analysis (using the same data sources used for figure 1), Utah, Florida, Nevada, Idaho, and Texas are the states with the lowest shares of people living in an underperforming county. In each of these states, less than 10% of the population lives in an underperforming county—a sharp contrast to the five states with the highest shares living in such a county (Illinois, Rhode Island, Michigan, Pennsylvania, and Ohio), where the share is above 80%. Among Seventh District states, Iowa (at 53%) and Indiana (at 68%) have the lowest shares of people living in underperforming counties.
Places with the highest median incomes are pulling ahead, even within Seventh District states
Consistent with previous studies, real GDP (in 2001–23) and employment (in 2000–23) grew the most in counties in the highest median income quintile in 2000, increasing a cumulative 77% and 33%, respectively (see the row for quintile 5 in figure 2). This feature of regional economic growth is a reversal of the post-World War II trend of poorer places growing more rapidly to “catch up” to richer places, as mentioned earlier. Looking more closely at the counties in the five Seventh District states, I note that even though growth among them is generally more sluggish than in the nation as a whole, the counties with the highest median household income (those in quintile 5) still experienced the fastest real GDP and employment growth among the counties in these states (figure 2).
2. Real gross domestic product (GDP) and employment growth rates are lowest in the poorest counties of Seventh District states
| Cumulative real GDP growth rate (2001–23) | Cumulative employment growth rate (2000–23) | |
|---|---|---|
| (- - - - - - - - - - - - percent - - - - - - - - - - - - ) | ||
| National | 59.3 | 19.3 |
| Counties in Seventh District states | 37.2 | 6.0 |
| Median household income quintile in 2000 | ||
| Quintile 1 | 39.5 | 8.0 |
| Quintile 1’s counties in Seventh District states | 3.2 | –18.3 |
| Quintile 2 | 55.4 | 23.0 |
| Quintile 2’s counties in Seventh District states | 18.0 | –10.7 |
| Quintile 3 | 51.2 | 18.7 |
| Quintile 3’s counties in Seventh District states | 23.4 | –6.7 |
| Quintile 4 | 56.1 | 20.7 |
| Quintile 4’s counties in Seventh District states | 27.6 | –4.8 |
| Quintile 5 | 77.2 | 33.2 |
| Quintile 5’s counties in Seventh District states | 43.5 | 12.7 |
| Among underperforming counties | ||
| In Seventh District states | 24.7 | –4.0 |
| Not in Seventh District states | 30.2 | 0.8 |
Meanwhile, the poorest counties in terms of median household income saw the slowest growth according to these two measures of economic activity: These counties’ real GDP growth and employment growth were 39.5% and 8%, respectively (see the row for quintile 1 in figure 2). Looking at all the counties in Seventh District states sorted by the distribution of national median household income, I note that employment growth over the 2000–23 period was negative in all but the richest counties (quintile 5), meaning that poorer counties in District states shed jobs, even though counties in the same median household income quintile in the nation as a whole experienced employment growth.
Finally, looking just at underperforming counties, which trail the nation in real GDP and employment growth, I note that those in Seventh District states grew more slowly, on average, than counties located elsewhere (see final two rows in figure 2). Real GDP growth in underperforming counties in Seventh District states was 25% over the 2001–23 period, while the number of jobs declined in these counties during 2000–23. In contrast, real GDP grew 30% in underperforming counties outside Seventh District states and there was small but positive employment growth in these counties.
Population growth was very sluggish on the whole in underperforming counties
Generally, counties whose real GDP and employment growth exceeded the nation’s also experienced greater population growth (figure 3). For such counties not in Seventh District states, their population grew 36% between 2000 and 2023. In contrast, population growth was substantially lower in underperforming counties; their population in counties outside the Seventh District increased just 5% percent over the same span.
3. Population growth is slower in counties in Seventh District states that trail the nation’s real gross domestic product (GDP) and employment growth
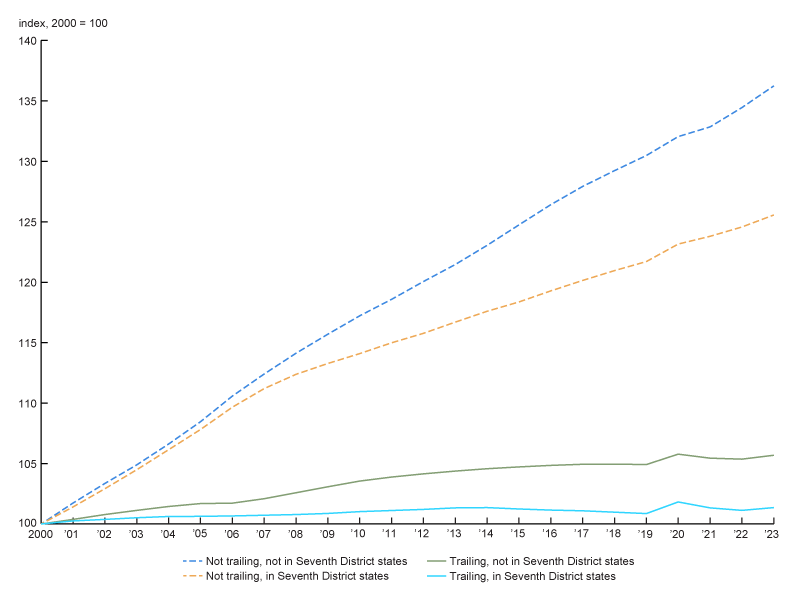
Sources: Author’s calculations based on data from the U.S. Bureau of Economic Analysis, U.S. Bureau of Labor Statistics, and U.S. Census Bureau.
Two trends jump out when looking more closely at the counties in Seventh District states. First, population growth is weaker in the Seventh District states’ underperforming counties than elsewhere (figure 3). This finding is consistent with slower GDP and employment growth in the Seventh District states’ underperforming counties (figure 2), as well as large outmigration flows to other parts of the U.S. Second, population growth in the Seventh District states’ higher-growth counties (i.e., those not trailing the U.S.) generally tracks other higher-growth counties until about 2006, after which a gap emerges and widens over time, likely reflecting exceptional and relatively stronger population growth in faster-growing parts of the South beginning around then (see the two dashed lines in figure 3).
Stronger economic performance does not directly translate into faster median household income growth
After being averaged across all counties, median household income increased 8.7% between 2000 and 2023 on an inflation-adjusted basis (or 82% on an unadjusted basis). Counties outside Seventh District states experienced larger gains in median household income over this period (figure 4), even if their real GDP and employment growth underperformed the nation’s. Within Seventh District states, underperforming counties experienced a decline in average inflation-adjusted median household income, ending 3% lower in 2023 than in 2000. In levels, average median household income (in 2023 dollars) went from $75,800 in 2000 to $73,800 in 2023 among underperforming counties in Seventh District states. Nontrailing counties (i.e., those with growth not trailing U.S. real GDP and employment growth) outside Seventh District states represent the group of counties experiencing the most economic growth; among these counties, average median household income (in 2023 dollars) increased from $75,700 to $86,200 over this same period.2
4. Median household income growth is slowest in counties in Seventh District states that trail the nation in real gross domestic product (GDP) and employment growth
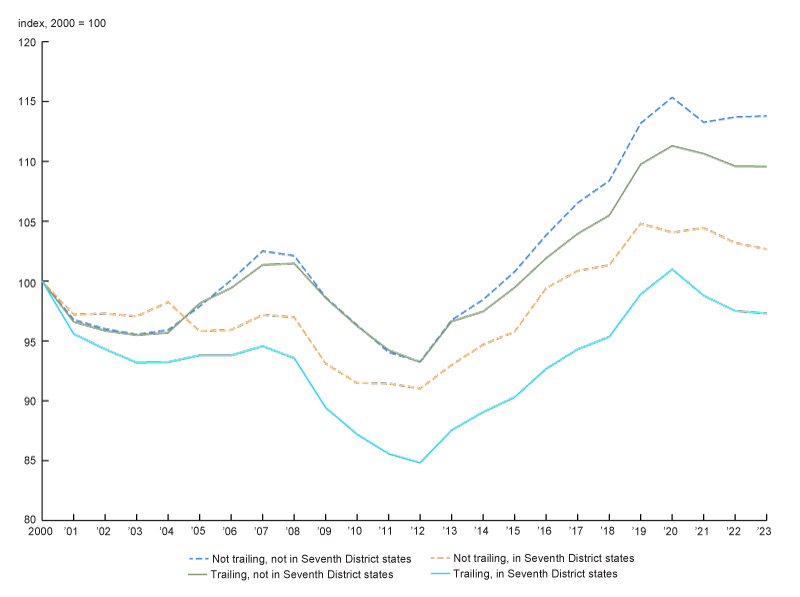
Sources: Author’s calculations based on data from the U.S. Bureau of Economic Analysis, U.S. Bureau of Labor Statistics, and U.S. Census Bureau.
Notably, nontrailing counties in Seventh District states had lower real median household income gains between 2000 and 2023 than underperforming counties outside District states. That is, nontrailing counties in Illinois, Indiana, Iowa, Michigan, and Wisconsin experienced smaller gains in median household income than underperforming counties outside these states. Real GDP growth in nontrailing counties in Seventh District states was 58 percentage points higher, on average, than that in trailing places outside these states between 2001 and 2023, according to my calculations using U.S. Bureau of Economic Analysis data. Nontrailing counties, which again perform on par with or better than the nation with respect to real GDP and employment growth, include midsize urban counties such as Will County, Illinois (whose largest city is Joliet) and Kent County, Michigan (whose largest city is Grand Rapids), as well as less populous ones like Stark County, Illinois, and Audubon County, Iowa. The lack of a clear relationship between local economic performance and median household income growth suggests that county-level GDP or employment growth may be imperfect targets for policymakers focused on improving living standards.
Nontrailing counties in Seventh District states are heterogeneous
Counties in Seventh District states that perform as well as or better than the nation in terms of both real GDP and employment growth are a minority of counties that share little in common with one another. These nontrailing counties’ lack of similarities makes it difficult to infer the contributors to their relative economic success. Only about 20% of the population in Seventh District states lives in one of these places. In addition to the counties discussed in the previous section (Will, Kent, Stark, and Audubon), they include suburban counties that are near midsize cities—namely, Boone County, Indiana (near Indianapolis); Eaton and Clinton Counties, Michigan (near Lansing); and Kendall and Grundy Counties, Illinois (near Joliet). Also included among these more economically successful places are Dane County, Wisconsin (where Madison is located)—which has a highly educated workforce, thanks in part to the presence of a large state university—and Polk County, Iowa (where Des Moines is located), and the surrounding counties—which stand out for being among the nation’s fastest-growing areas. However, many suburban counties, state capitals, college towns with highly educated workforces, and midsize cities in Seventh District states also underperform, suggesting that these qualities and features may not in and of themselves spur local economic growth. It is possible that some of the drivers of economic growth may be difficult to quantify in economic data; such drivers include preferences for weather, local capacity for economic development initiatives, or the presence of a civic-minded employer or local community organization.
What are the implications of my findings and possible next steps?
Between 2000 and 2023, counties in Illinois, Indiana, Iowa, Michigan, and Wisconsin stand out for their sluggish economic growth relative to the nation’s, higher shares of the population living in economically underperforming places, and slower population and median household income growth. Widespread economic underperformance in the five states of the Chicago Fed’s Seventh District means that, over time, the nation’s economic activity has become less concentrated in this part of the country. For example, in 2000, economic activity in those five states accounted for nearly 13% of the nation’s GDP, but that share had fallen to 10% by 2024, according to my calculations using U.S. Bureau of Economic Analysis data. In addition, the poorest counties in terms of median household income, experienced the slowest economic growth, meaning that these places fell even further behind in terms of their levels of economic activity.
Analyzing the divergent economic trajectories of regions can be helpful for understanding how monetary policy, implemented at the national level, can affect various parts of the country differently (i.e., the geographic incidence of monetary policy). Research points to evidence that the strength of monetary policy transmission may depend on regional economic conditions, finding, for instance, that monetary policy transmission is stronger in more interest-rate-sensitive places, such as where households are more exposed to variable-rate mortgages or where firms are more reliant on bank credit, as noted earlier. However, research is mixed on whether slower-growing regions are more or less sensitive to monetary policy, suggesting the need for additional research. More research would be helpful to further clarify which specific measures of regional economic conditions are most relevant for identifying the geographic incidence of monetary policy and to better understand how optimally calibrating monetary policy to national aggregates can have heterogeneous effects for regions that are not growing as quickly.
The economic trends in Illinois, Indiana, Iowa, Michigan, and Wisconsin also suggest a unique set of challenges for local economic development practitioners. Specifically, in these states, stronger labor demand, particularly for higher-skill workers, is necessary before workforce development efforts that raise the skill levels of workers and better match them to local employers can take hold. Put differently, it may be important for practitioners to coordinate their work to expand local economic capacity and workforce development efforts, particularly if growing the supply of skilled technical workers is involved (National Academies of Sciences, Engineering, and Medicine, 2017). In contrast, in places where economic growth and labor demand are strong, local practitioners may wish to focus more on matching workers and their skills with the needs of local employers.
Explaining the prevalence and nature of economic underperformance in the Seventh District states is an area for future research. Seeing how economically underperforming counties in these five states fare worse than those located elsewhere suggests that local factors may be important. Notably, the Midwest economy features a large role for the agricultural and manufacturing sectors, which are two industries that have been in relative decline in terms of their value added to both GDP and employment for many decades. In addition, it may also be important to consider the additional role of house prices in attracting or detracting new residents, as well as how new business starts have fared in comparison with firm exits. Finally, subsequent research could look beyond median household income as an indicator for household economic well-being and examine additional measures, such as county-level pre-tax income, post-tax income, post-tax income plus transfers, and GDP per capita.
I am grateful to Gerald Cohen and Jed Kolko for constructive comments and feedback.
Notes
1 In this article, I consider counties in the entirety of Illinois, Indiana, Michigan, and Wisconsin, though only major portions of these four states and the entirety of Iowa officially make up the Seventh Federal Reserve District, which the Federal Reserve Bank of Chicago serves. In other words, the analysis in this article includes counties in the entirety of all five Seventh District states, though some are not in the geographic boundaries of the Seventh District. With that said, the specific counties named in this article are of those within the Seventh District’s geographic boundaries.
2 All the numerical values reported in this paragraph are from my calculations based on data from the U.S. Bureau of Economic Analysis, U.S. Bureau of Labor Statistics, and U.S. Census Bureau.
Appendix
Data on county real GDP are from the U.S. Bureau of Economic Analysis (BEA), which report these estimates beginning in 2001 through 2023. Data on county employment are from the U.S. Bureau of Labor Statistics’ (BLS) Quarterly Census of Employment and Wages (QCEW) and correspond to private sector employment. An advantage of these two sources of county-level data is that they measure where the economic activity occurs, so a “residence adjustment” that accounts for intercounty commuting is not necessary.
County median household income estimates are from the U.S. Census Bureau’s Small Area Income and Poverty Estimates Program. Population data are also from the Census Bureau.
National estimates of real GDP growth are from the BEA’s National Income and Product Accounts of the United States. National estimates of job growth are from the BLS’s QCEW.
Counties are chosen as the unit of analysis because they strike a balance between larger core-based statistical areas (CBSAs) and smaller census tracts in capturing local economic activity at a policy-relevant level of geographic granularity (e.g., Troland et al., 2025). All county-level analyses are population-weighted.


