What Can Revisions to the NFCI Tell Us About Stock Market Volatility?
In this blog post, we document that recent revisions to the Chicago Fed’s National Financial Conditions Index (NFCI) have been large and clustered in time—a pattern not seen since the 2007–09 global financial crisis. As financial conditions tightened early on during the Covid-19 outbreak here in the U.S., there were large positive revisions to the NFCI through much of March. We show that revisions of this magnitude and in this direction have often preceded substantial increases in stock market volatility. More recently, in late March and April, the large negative revisions to the NFCI suggest that financial conditions are improving faster than expected by the historical relationships underpinning the index.
Sources of NFCI revisions
The NFCI provides a comprehensive weekly update on U.S. financial conditions in money markets, debt and equity markets, and the traditional and “shadow” banking systems based on 105 weekly, monthly, and quarterly indicators of financial activity.1 The weekly index is constructed to have an average value of zero and a standard deviation of one over a sample period extending back to 1971. With this construction, positive values of the NFCI have been historically associated with tighter-than-average financial conditions, while negative values have been historically associated with looser-than-average financial conditions. (See the Economic Perspectives article titled “Monitoring financial stability: A financial conditions index approach” for further details.)
Previous weeks’ readings of the NFCI can be revised with each new release of the index. Revisions occur when the NFCI is reestimated each week, and their size and direction depend upon 1) incoming data for the current and past weeks, 2) revisions to already included data, and 3) changes in the estimated parameters of the mixed-frequency dynamic factor model used to construct the index. For the vast majority of data series in the NFCI, data revisions are not an issue, and the long history of the index means that changes in estimated model parameters tend to be very small from week to week. Thus, sizable revisions to the NFCI are most often driven by incoming data.
Not all of the 105 data series used to construct the NFCI are available through the current week. For those series that are missing, the model for the NFCI uses the available data and the historical dynamics of the index to form a prediction of what any missing data series are likely to show when constructing the most recent values of the index.2 Large revisions to the NFCI can then occur if there is a substantial deviation between what the model expected and the actual data when they are incorporated at a later date. In this sense, revisions are informative of unexpected changes in financial conditions.
Recent NFCI revisions in historical context
Table 1 summarizes the magnitude of historical revisions to the NFCI since 2011.3 On average, revisions tend to be very small for the previous eight weeks, at less than 0.02 of a standard deviation unit for the index; moreover, the revisions shrink in size the further back in time over the course of the index’s history that one goes. Over the past two months, however, the NFCI’s recent values have been subject to historically large week-to-week revisions. While not outside of the range that occurred during the global financial crisis of 2007–09, these revisions to the NFCI have nonetheless been large compared with other revisions since 2011. (See “Diagnosing the financial system: Financial conditions and financial stress” for more details on revisions during the 2007–09 period.)
Table 1. Mean absolute values of revisions to the National Financial Conditions Index (NFCI)
| Series | T–1 | T–2 | T–3 | T–4 | T–5 | T–6 | T–7 | T–8 |
|---|---|---|---|---|---|---|---|---|
| NFCI | 0.017 | 0.011 | 0.007 | 0.005 | 0.005 | 0.004 | 0.003 | 0.002 |
Sources: Authors’ calculations based data from the Federal Reserve Bank of Chicago; and Federal Reserve Bank of St. Louis, ALFRED database.
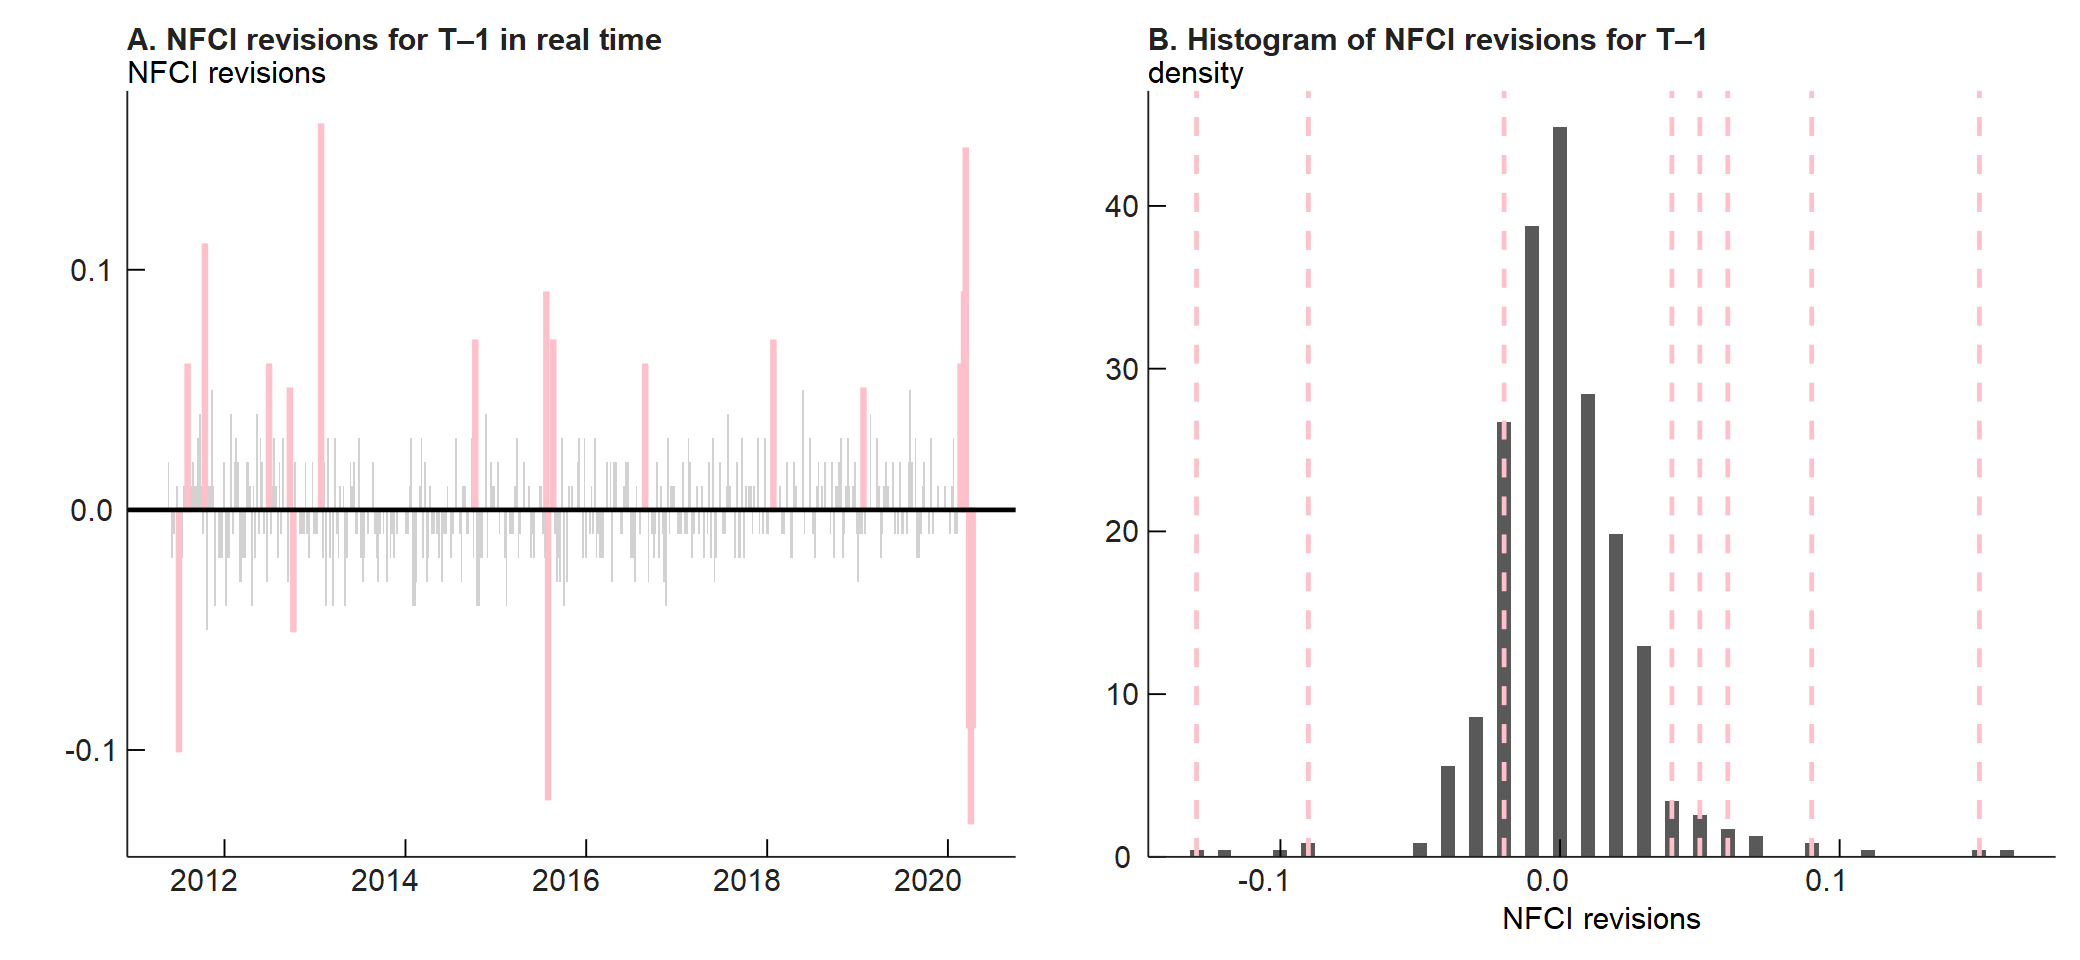
Panel A of figure 1 plots the NFCI revision to the previous week’s value (i.e., the T–1 value) in real time for every weekly release since May 2011, highlighting in pink when the absolute value of the revision was greater than 0.05.4 Positive revisions correspond to financial conditions that are tighter than what was previously estimated, and negative revisions point to looser financial conditions than what was previously estimated. As shown in panel A, there have been week-to-week revisions to the NFCI in parts of its history that are similar in scale to those of recent months. That said, the clustering of such revisions, as seen in late March and April of this year, is rare.
To demonstrate this further, we present a histogram of these NFCI revisions in panel B of figure 1. Revisions to T–1 values are typically small and clustered tightly around zero (mean = 0.001; standard deviation = 0.026). The dashed pink vertical lines overlaid on the histogram correspond to recent revisions, starting with the NFCI release for the week ending February 21, 2020. Panel B shows that the magnitudes of these recent week-to-week revisions have been extremely large by historical standards—coming in at two to six standard deviations from the average NFCI revision every single week.
Figure 1. Revisions to the T–1 values of the National Financial Conditions Index (NFCI)
Sources: Authors’ calculations based on data from the Federal Reserve Bank of Chicago; and Federal Reserve Bank of St. Louis, ALFRED database.
The connection with stock market volatility
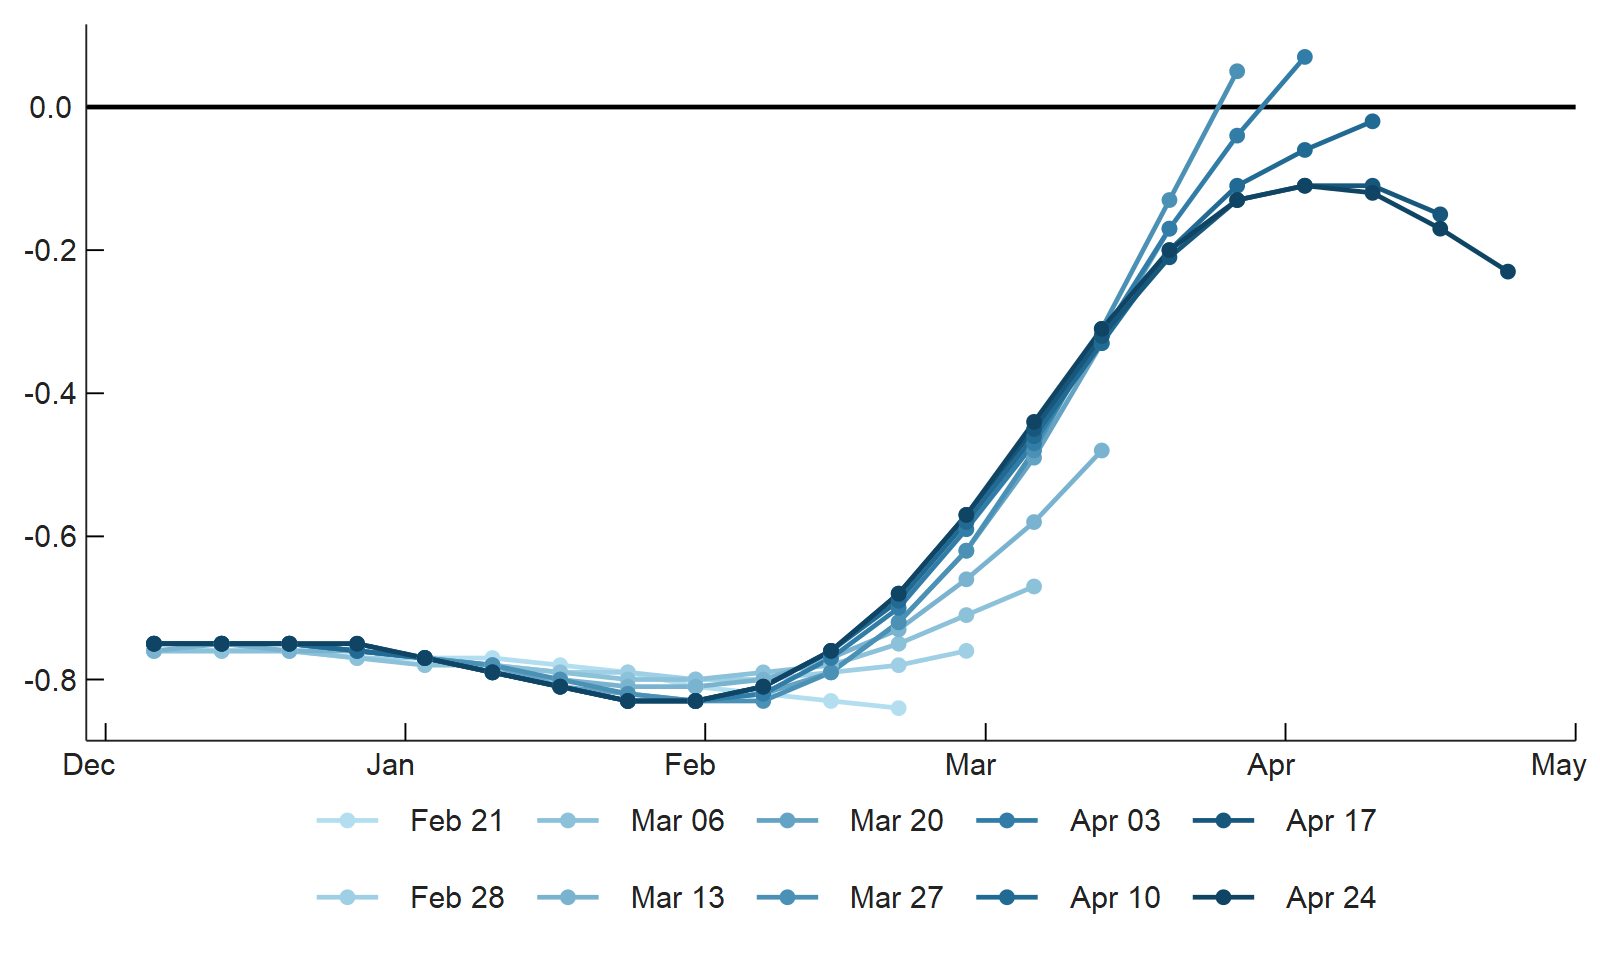
In recent weeks, NFCI values beyond the previous week have also been revised more than normal. Figure 2 plots the real-time history of the NFCI since the beginning of December 2019, starting with the release for the week ending February 21, 2020. From February 21 through March 20, 2020, the NFCI had large positive week-to-week revisions, as financial markets tightened in the early stages of the Covid-19 outbreak in the U.S. However, since March 20, there have been large week-to-week revisions in the opposite direction, as financial markets have started to stabilize.
Figure 2. National Financial Conditions Index revisions since February 21, 2020
Interestingly, the recent pattern of revisions mirrors that of U.S. stock market volatility. For instance, the Chicago Board Options Exchange’s (CBOE) measure of implied volatility—its Volatility Index (VIX), based on call and put options for the Standard & Poor’s (S&P) 500 stock market index—increased from 15 in mid-February to 75 in mid-March before pulling back to 40 or so by mid-April.5 The VIX is among the 105 financial indicators included in the NFCI, so the apparent correlation between recent NFCI revisions and the VIX’s movements may be somewhat surprising. However, periods of elevated stock market volatility have in general been more likely to correspond with larger-than-normal NFCI revisions.
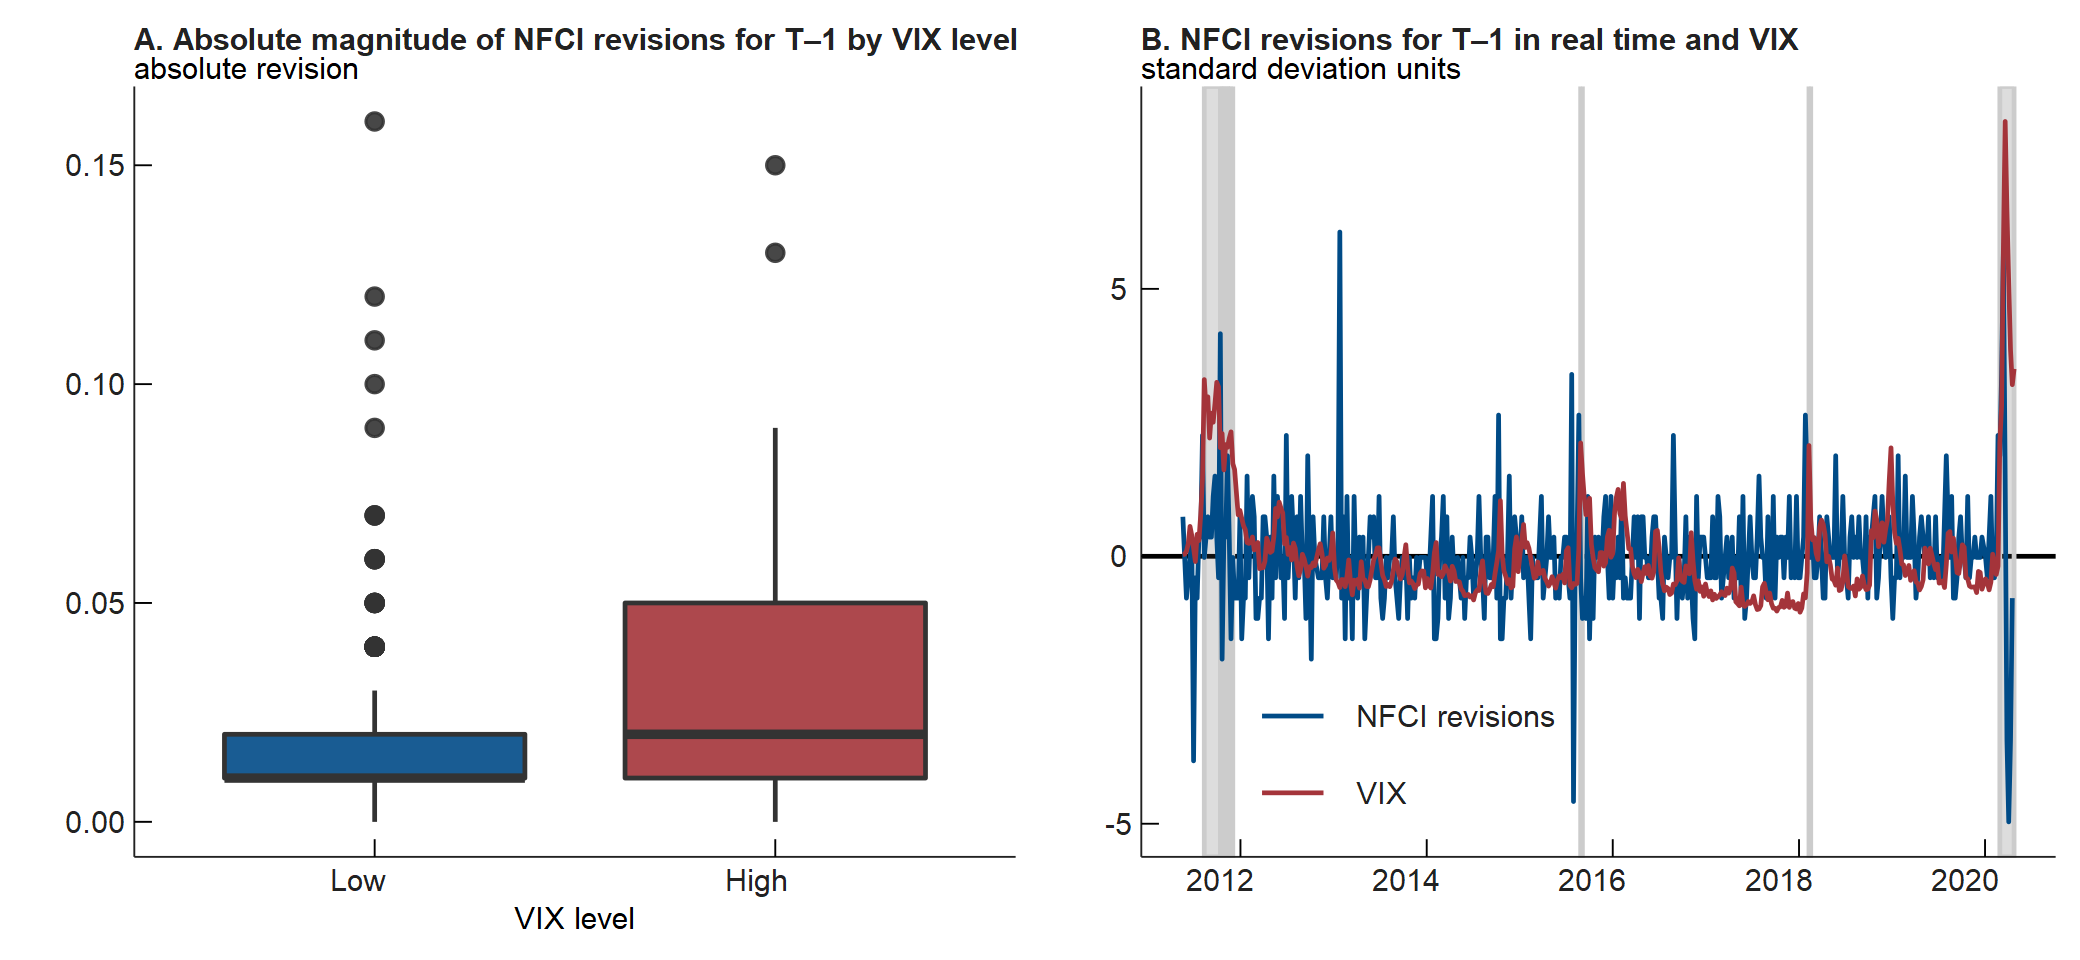
To demonstrate this, we categorize revisions to T–1 values of the NFCI, again in real time, since May 2011 by the level of the VIX and present the results as a box and whisker plot in panel A of figure 3.6 The plot shows that the absolute values of T–1 revisions to the NFCI are on average twice as large (0.041 versus 0.016, with the difference being statistically significant given the p-value = 0.009) when the index was released in a week where the VIX was high—defined as exceeding 31.25, its 95th percentile value since May 2011. In fact, large positive T–1 revisions to the NFCI have tended to lead by a few weeks periods where stock market volatility was elevated. This can be seen in panel B of figure 3, which plots each T–1 revision to the NFCI (by the date the revision occurs) and VIX value since May 2011 (see note 3). Panel B also makes clear, however, that there have been some instances of large positive T–1 NFCI revisions when stock market volatility was not particularly elevated (notably, January 2013). Moreover, there have even been a few large positive NFCI revisions that lagged the initial spike in volatility (mostly early in the sample).
To understand why some instances of large positive revisions to T–1 values of the NFCI did not precede stock market volatility, we have to look at what precisely drove these revisions. For instance, the large spike in revision in January 2013 was due to a change in the composition of data series in the NFCI (five series were added and two were replaced). Obviously, we wouldn’t expect this kind of revision to be correlated with stock market volatility. We may, however, reasonably expect revisions driven by volatility in the incoming data to be related to the level of the VIX. In this case, the NFCI model’s estimates are likely to be especially imprecise, which in turn leads to larger revisions as incoming data are incorporated. If the volatility originates at first outside of equity markets, then NFCI revisions that precede increases in the VIX may reflect the spread of uncertainty throughout the financial system.
Figure 3. Revisions to the T–1 values of the National Financial Conditions Index (NFCI) and the CBOE Volatility Index (VIX)
Sources: Authors’ calculations based on data from the Federal Reserve Bank of Chicago; Federal Reserve Bank of St. Louis, ALFRED database; and Chicago Board Options Exchange (CBOE) from Haver Analytics.
Figure 4 further quantifies the relationship between NFCI revisions and stock market volatility through a receiver operating characteristic (ROC) analysis (excluding the January 2013 revision, given what we just noted about it) at leads and lags of periods in time where the VIX exceeded its 95th percentile value. ROC analysis is a nonparametric classification method used to assign a score (the area under the ROC curve, or AUC) to a variable based on its ability to correctly classify, in this case, periods of high and low stock market volatility. An AUC value statistically significantly different from 0.5 indicates that NFCI revisions have a better chance at correctly classifying both types of periods than a random guess made on the basis of their historical frequency.7
In figure 4, we see a statistically significant leading relationship (peak AUC values to the left of zero and distinct from 0.5) between NFCI revisions and elevated stock market volatility. The AUC values reflect a 70–80% rate of accuracy in classifying periods of both low and high stock market volatility correctly at leads of up to three weeks. The VIX is often used as a proxy for economic uncertainty. In this light, the timing of its correlation with NFCI revisions shown in figure 4 likely reflects an increase in general economic uncertainty, manifested in revisions to the NFCI, working its way into broad financial conditions through equity markets. Recent large negative revisions to the NFCI that have tracked along with the decline in the VIX (see panel B of figure 3) in this case are then a potential sign of improvement for both financial conditions and economic uncertainty.
Figure 4. Receiver operating characteristic (ROC) analysis of National Financial Conditions Index T–1 revisions’ ability to classify periods of elevated stock market volatility

Sources: Authors’ calculations based on data from the Federal Reserve Bank of Chicago; Federal Reserve Bank of St. Louis, ALFRED database; and Chicago Board Options Exchange (CBOE) from Haver Analytics.
Conclusion
Over the past two months, the NFCI’s revisions, with their abnormal size and temporal clustering, are far different than anything we’ve seen since the global financial crisis of 2007–09. That said, they still exhibit some features we have seen in the recent past, such as a close connection with general economic uncertainty and a tendency to lead substantial increases in stock market volatility. Tracking week-to-week revisions to the NFCI can, therefore, be a useful leading indicator of the trajectory of financial markets and the broader economy. The recent streak of large negative revisions to the NFCI suggests that amid the Covid-19 pandemic, financial conditions are improving faster than expected by the historical relationships underpinning the NFCI.
Notes
1 Additional background information on the NFCI is available online.
2 The mechanics of the revision process are as follows: The model is estimated using the Kalman filter, which concentrates out missing data at each point in time and smooths through the index history based on its historical dynamics. This process produces an implicit estimate of any missing data. When these data are eventually observed, the filter instead takes any new information in them into account when updating the value of the index.
3 We construct revisions by using the archived NFCI releases from the St. Louis Fed’s ALFRED database, available online.
4 Two weeks during this period are omitted because of a lack of historical NFCI information on the ALFRED database.
5 The numbers reported here and in the remainder of the blog post refer to weekly averages of the VIX.
6 The bottom and top edges of the boxes in panel A of figure 3 correspond to first and third quartiles of the data in each category, and the bold line between them is the median value. The lines extend out from the box to 1.5 times the interquartile range, or IQR (Q3 minus Q1); and the dots are outliers that are more than 1.5 times the IQR away from the median value.
7 The statistical significance of AUC values is judged relative to a benchmark of 0.5; variables that are positively correlated with stock market volatility in our example will have AUC values greater than 0.5, and variables that are negatively correlated with stock market volatility will have AUC values less than 0.5. The 95% confidence intervals (CIs) for AUC values shown in figure 4 are estimated from 500 bootstrap replications and are small-sample-bias-corrected.


