What Do Michigan’s Leading Economic Indicators Say About the State’s 2020 Growth Prospects?
This blog looks at the current state of leading economic indicators for the state of Michigan to gain insight on the possible trajectory of the Michigan economy.1
There is a long tradition within economic analysis of analyzing leading economic indicators—current economy measures that are thought to indicate the direction of the business cycle six to nine months ahead of time.
Perhaps the best known index of leading indicators is that produced by the Conference Board (CB). Since 1959, the Conference Board has produced an Index of U.S. Leading Economic Indicators (the CB-LEI) that forecasts the direction of aggregate economic activity. The components of this index have changed over time. Currently, it comprises 10 indicators.
More recently, the Philadelphia Federal Reserve has developed leading economic indicators for each of the 50 states. The goal of the Philadelphia indexes is to forecast growth rates for the Philadelphia Fed’s state coincident indexes—their measure of current economic conditions in each of the 50 states, six months ahead.
The Philadelphia Fed’s index for each state contains three economic measures that are available at the state level: the current value of the coincident index itself, state-level housing permits (one to four units), and state initial unemployment insurance claims. The additional variables in each state index are how quickly manufacturers receive deliveries of materials from suppliers, a sub-index from the U.S. ISM manufacturing survey,2 and financial variables that are only available at the national level.
In this blog, I discuss each of the state level Philly Fed measures individually, along with a few additional measures from the CB that are available at the state level for Michigan—average weekly manufacturing hours and consumer confidence. I also discuss some measures that are not in either index but are likely relevant for Michigan’s economy in particular. Following a discussion of the recent pattern in the Philly Fed’s coincident index, I introduce the indicators grouped into two groups: production related and consumption related.
Coincident Index
According to the Philly Fed’s Michigan coincident economic activity index, shown in chart 1, Michigan’s economy slowed through most of 2019, even slightly contracting during the third quarter, before rebounding slightly at the end of the year. In keeping with this, Michigan’s leading activity index was negative for ten of the past 18 months.
1. Federal Reserve Bank of Philadelphia Michigan Coincident Economic Activity Index, 2012-present, year-over-year percentage change
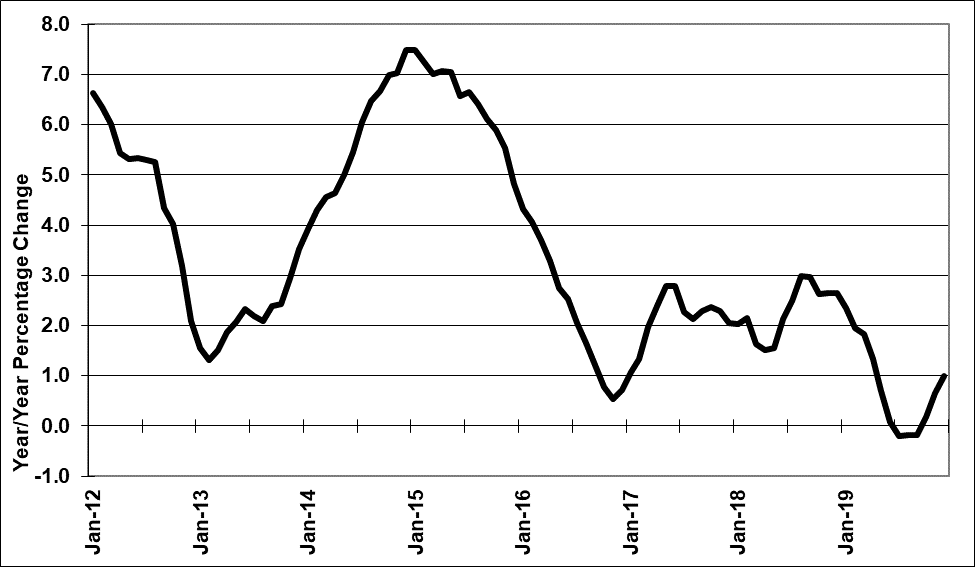
Michigan’s coincident activity index is in line with estimates of Michigan’s 2019 economic performance from the Bureau of Economic Analysis (BEA). According to the BEA, Michigan’s economy only grew at a 0.8% pace through the first three quarters of 2019. Meanwhile, between 2010 and 2018, according to the BEA, Michigan’s economy expanded at an annualized pace of 1.7%.
Production/Manufacturing
The first set of leading indicators that I discuss are those related to the manufacturing sector.
A leading economic variable from the manufacturing sector that is in the CB-LEI and is available for the state of Michigan is the average workweek for a manufacturing worker. (Shown in chart 2.)
2. Average weekly manufacturing hours, Michigan, seasonally adjusted, 2001-present
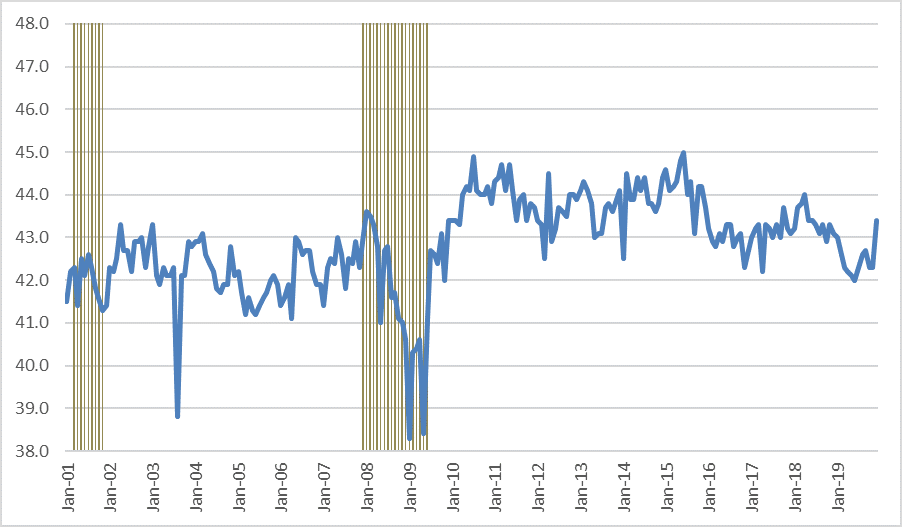
Source: Bureau of Labor Statistics/Haver Analytics.
Weekly manufacturing hours jumped from 42.3 in November to 43.4 in December, likely a result of auto manufacturers continuing to bring production back online after last fall’s UAW/GM strike. If weekly manufacturing hours remain at current levels, it may indicate the slowdown in hours during 2018 and 2019 was trade-related as well as strike-related and not an indicator of a broader manufacturing slowdown. We should see weekly manufacturing hours bounce back through the first half of 2020 as GM and other auto suppliers look to make up for lost production during the strike, which should help boost 2020 production totals.
The chart below shows auto production from Michigan assembly plants along with U.S. new light vehicle sales.
3. U.S. new vehicle sales and Michigan automobile production, millions of units, 2002-present
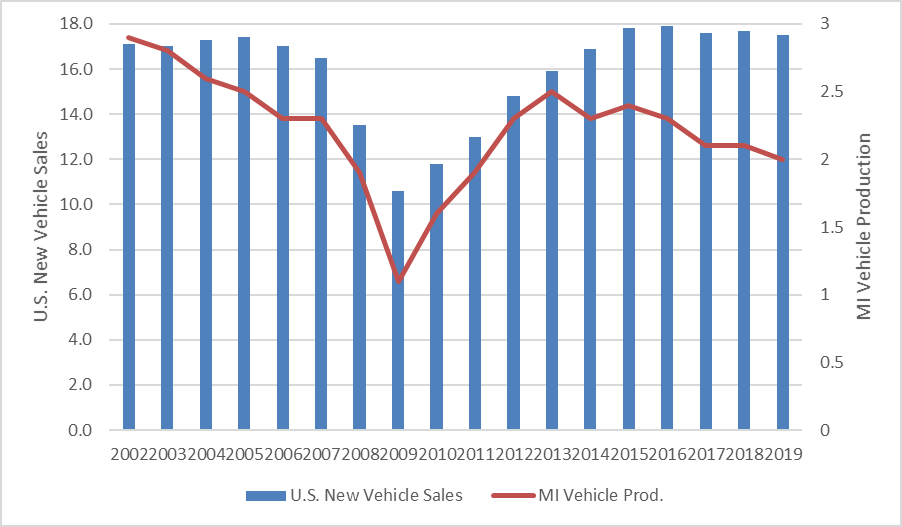
Michigan vehicle production has slightly tailed off as new vehicle sales have come down from their record high level of 17.9 million units in 2016. Some of the drop may be attributed to lower car production, though Michigan contains numerous light truck manufacturing platforms, which have allowed the state to take advantage of the shift in consumer preferences from cars to light trucks. Also, 2019 production levels were adversely impacted by the UAW-GM strike that lasted for 40 days. Consensus forecasts are for further drops in vehicle sales in 2020 and 2021, which will visibly dampen Michigan economic growth.
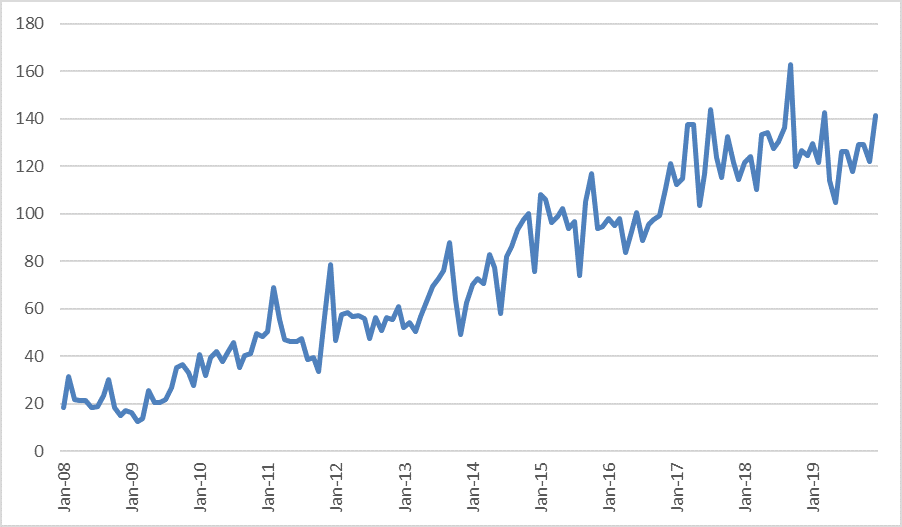
There are also some indications that increased uncertainty in trade policy negatively impacted Michigan exports.
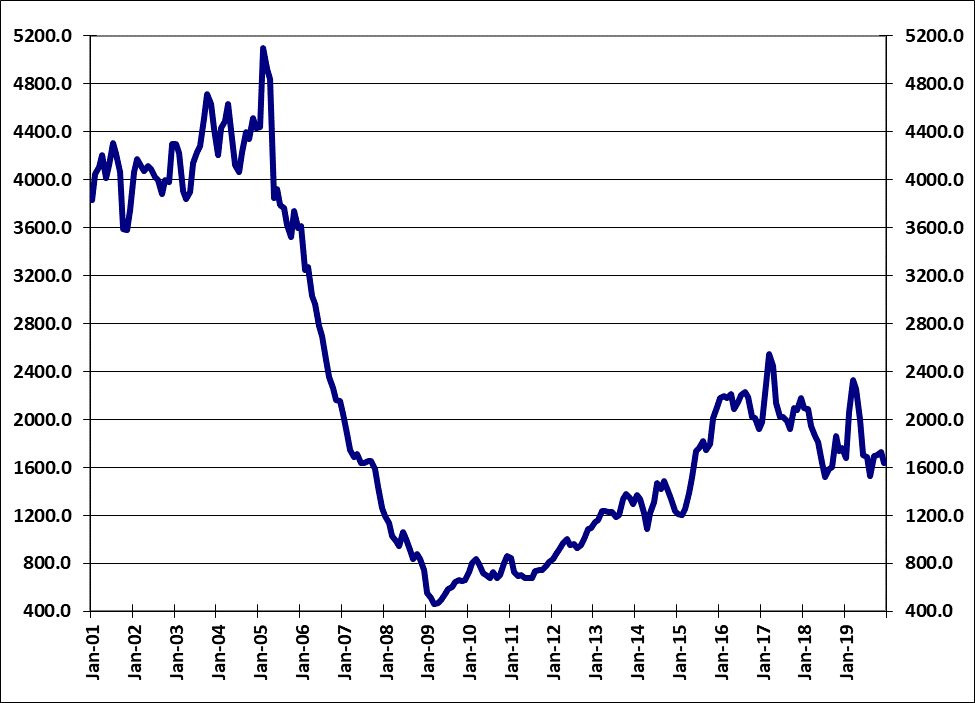
4. Exports originating from Michigan to the rest of the world, 2012 dollars, 2001-present

Not surprisingly, real exports behaved similarly to weekly manufacturing hours. This chart suggests that Michigan’s exposure to global manufacturing and the continuing strength of the dollar have negatively impacted exports originating from Michigan and may continue to do so in 2020.
Consumption
We now look at variables related to consumer spending. Consumer spending accounts for approximately 70% of state and national economic activity. Recent economic growth can be mostly attributed to growth in consumer spending. Normally, consumers spend more if they feel more confident about the stability of their own financial situation and the general economy. The Conference Board’s consumer sentiment survey does not include all 50 states, but Michigan is among those surveyed. The chart below displays Michigan consumer sentiment.
5. Michigan consumer sentiment (SA), 2008-present
Except for the blip in early 2018 that coincided with the passage of the Tax Cuts and Jobs Act, consumer sentiment has held fairly steady since late 2016. Based on the survey, consumers expect the current economic situation to remain in place, which likely equates to modest growth.
Housing permits are part of both the CB-LEI and the Philly Fed’s measure and available at the state level from the Census Bureau. Expectations of modest growth in consumer spending don’t seem to be enough to spur an acceleration in Michigan’s housing market. The chart below looks at Michigan housing permits.
6. Michigan housing permits, 3-month moving average, 2001-present
According to the Census Bureau, 21,565 residential housing permits were issued in Michigan in 2019, about 38% below the 30-year average. Since 2017, housing permits have trended lower. This is attributed to numerous causes including higher construction costs and the lack of supply in the starter-priced segment that is attractive to first-time buyers.3 The issues that are currently viewed as hindering permit issuance seem likely to linger for at least the medium term.
Consumer sentiment would be negatively impacted if unemployment started to rise. Initial unemployment claims are included in the CB-LEI and the Philly Fed measures. Also, initial unemployment claims are made available by the State of Michigan.
7. Michigan initial unemployment claims, monthly (SA), 2001-present
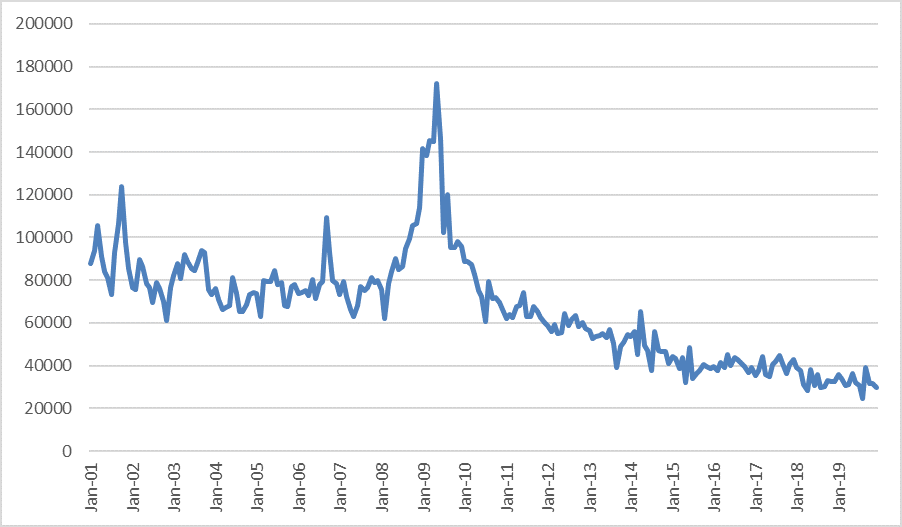
As shown chart 7, Michigan’s initial unemployment claims were twice as high in the 2000s as they are currently. After spiking during the Great Recession, initial claims fell steadily until 2018 and have held steady since then. The chart supports the notion that Michigan’s labor market has remained tight in the past couple of years. Chart 8 shows initial claims as a percentage of those eligible to be covered by unemployment insurance.
8. Initial claims (4-week moving average) as a percentage of covered employment, Michigan, years 2009, 2019, and 2020, index: Year 2006 = 100
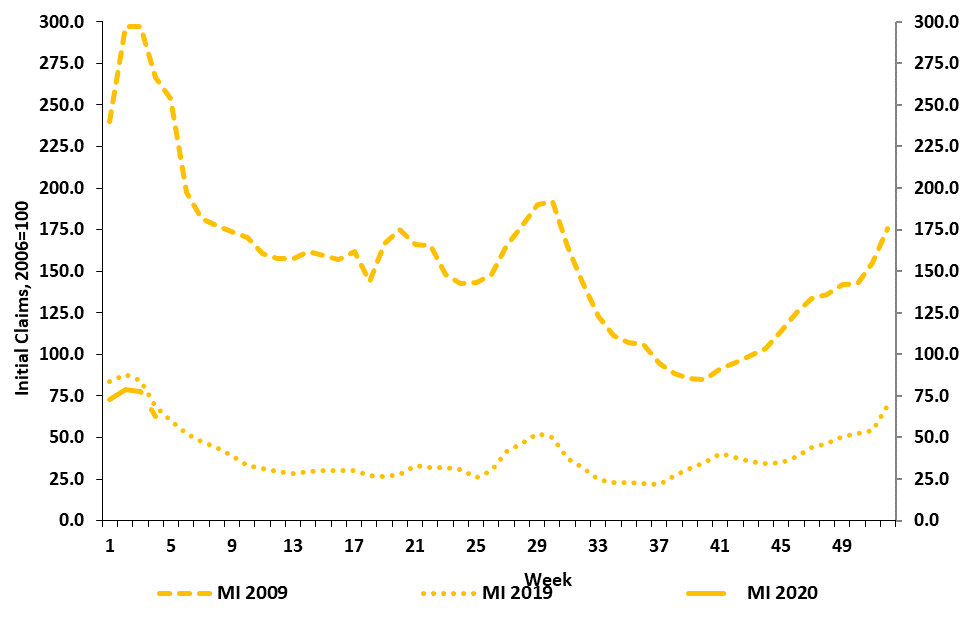
Although initial claims have flattened out in recent months, the number of employees eligible for unemployment insurance has grown at a steady rate. For the majority of 2019, the percentage of the work force claiming unemployment has remained below that of last year. As shown in the previous chart, initial claims did jump in September with the UAW-GM strike, but they immediately fell back in October. Overall, despite a slowing in the pace of employment growth, Michigan’s labor market remains relatively tight. The state’s unemployment rate is at 3.9%, a rate rarely seen since the late 1990s.
Conclusion
What does 2020 hold in store for Michigan? This blog analyzed some of the leading indicators for Michigan’s economy. Recent updates from those indicators are consistent with slow and steady growth. The University of Michigan’s RSQE unit expects slow and steady growth as well. The biggest downside risk for Michigan’s economy, as I see it, is the projected slowdown in new vehicle sales. Other potential downside risks include supply-chain impacts or additional economic disruptions resulting from the spread of the coronavirus, any escalation of the ongoing trade war with China, or the continuing downward trend in business capital investment.
However, if trade negotiations continue to progress, as with the recent passage of the U.S.-Mexico-Canada free trade agreement (USMCA) into law, Michigan’s economy is likely to benefit from steady growth in consumer spending, supported by wage gains in a tight labor market.
Notes
1 The indicators included contain data collected prior to the contagion of the coronavirus.
2 Except for those states in the Philadelphia Fed District.
3 More information is available online.


