Tracking Seventh District Manufacturing
There is a greater concentration in manufacturing among the five states of the Seventh Federal Reserve District than in the nation. For example, as measured by the share of payroll jobs in manufacturing, Indiana ranked first among the 50 states in 2007; Wisconsin, second; Iowa, fourth; Michigan, seventh; and Illinois, 19th. For this reason, we at the Federal Reserve Bank of Chicago tend to closely watch the manufacturing sector. In fact, our watchfulness often becomes close scrutiny during times like the present when the U.S. economy shows signs of slowing. (Manufacturing activity has tended to be highly sensitive to general business downturns.)
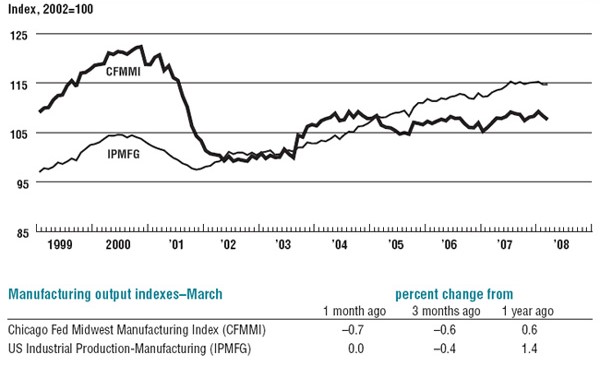
The Chicago Fed Midwest Manufacturing Index (CFMMI) is a public statistical release that the Federal Reserve Bank of Chicago has been producing since 1987. This monthly release tracks manufacturing output for the Seventh District states (Illinois, Indiana, Michigan, Iowa, and Wisconsin) and compares it to the manufacturing component of the Industrial Production Index (IPMFG) produced by the Federal Reserve Board of Governors. The chart below, taken directly from the March release of the CFMMI, shows historical data comparing the CFMMI to the IPMFG. Over the decade, Midwest output growth has lagged the nation. During the current slowdown in national economic activity, both the IPMFG and the CFMMI have slowed and declined at a very mild rate in comparison with past episodes.
1. Chicago Fed Midwest Manufacturing Index
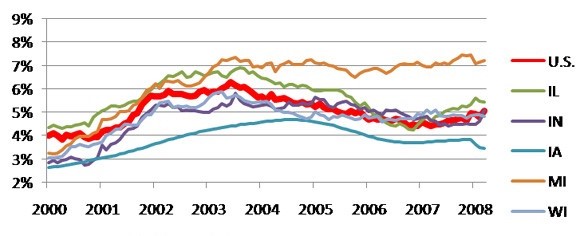
Industry concentration in specific industrial sectors influences economic performance among District states. In particular, transportation equipment and machinery are bellwethers of state economic performance in the District.
Since the beginning of this decade, the automotive-intensive states of Indiana and especially Michigan have experienced a softening of their labor markets relative to the national average.
Meanwhile, by the same measure, the machinery-intensive states of Illinois and Iowa have outperformed the nation. The remaining state, Wisconsin, deviates from this pattern, being a machinery-intensive state with an unemployment rate that has deteriorated relative to the national average.
2. 2000s unemployment rate (SA, monthly)
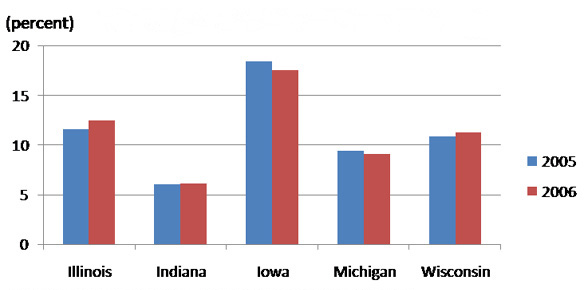
The charts below compare these states’ concentration in both machinery and transportation equipment, respectively. Manufacturing activity in these industries is compiled by the U.S. Census Bureau’s Annual Survey of Manufactures (ASM). Specifically, the Census data measure “value added” by manufacturing establishments within each state. Value added roughly corresponds to the value of shipments of manufactured establishments, net of intermediate inputs to production, such as fuel, materials, parts, and components that are purchased from other establishments. In this sense, value added is manufacturing output.
3. Machinery sector's share of state value added in manufacturing
4. Transportation sector's share of state value added in manufacturing
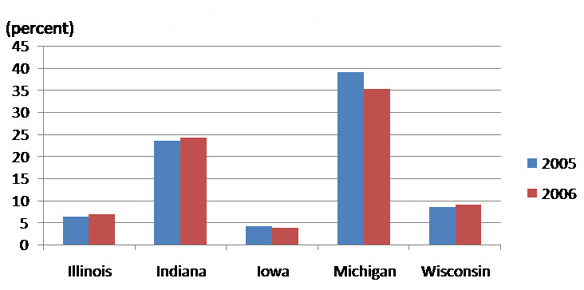
It takes much time and effort for the U.S. Census Bureau to compile these data, so that detailed information on output by specific industry sector and location are issued with a one or two year lag. The data above, for example, refer to 2005 and 2006.
To keep more current than the Census statistics allow, our CFMMI constructs sector-specific estimates of manufacturing output for the overall Seventh District. These estimates are primarily based on data reported on payroll hours worked in manufacturing establishments across the District, and these data are usually available with only one month’s lag. When complete data on value added are issued by the U.S. Census Bureau, we adjust or benchmark our CFMMI data series to correspond to that data.
There are four major sectors of the CFMMI: auto, steel, machinery, and resource. The CFMMI is made up of 15 North American Industry Classification System (NAICS) codes of hours worked data. The breakdown of the NAICS codes is given under each graph (such as the one below) on the press release every month. The auto sector components are plastics & rubber products (326) and transportation equipment (336). Primary metal (331) and fabricated metal products (332) compose the steel sector. The machinery sector is made up of machinery (333), computer & electronic product (334), and electrical equipment, appliance, & components (335). There are five categories for the resource sector: food manufacturing (311), wood product (321), paper (322), chemical (325), and nonmetallic mineral product (327). The overall CFMMI is composed of the four sector components as well as these industries: printing & related support activities (323), furniture & related product (337), and miscellaneous manufacturing (339).
As seen by the two sector charts below, taken directly from the March CFMMI release, the District’s output growth paths in the machinery and auto sectors have diverged. While the machinery sector of the CFMMI is slowly outpacing the overall CFMMI, the auto sector of the CFMMI continues to fall below the overall CFMMI. Such developments can help us understand differences in economic performance around the Seventh District.
5. Machinery sector
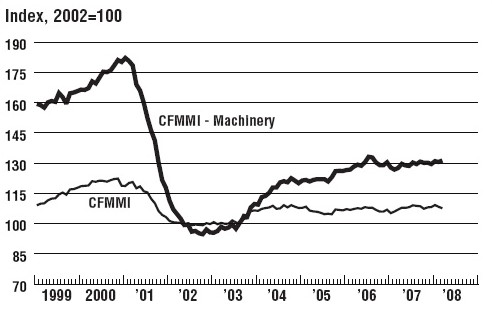
Machinery; computer and electronic products; electrical equipment; appliance, and components manufacturing.
6. Auto sector
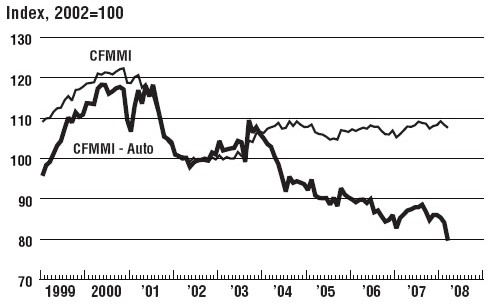
Plastics and rubber products; transportation equipment.
To see more information about the CFMMI, please check the Federal Reserve Bank of Chicago’s website. Additionally, some of the other Federal Reserve Banks also have manufacturing indexes/surveys. Please see below for some of those links:
Federal Reserve Bank of Philadelphia Business Outlook Survey
Federal Reserve Bank of New York Empire State Manufacturing Survey
Federal Reserve Bank of Richmond Manufacturing Conditions Survey
Federal Reserve Bank of Kansas City Survey of Tenth District Manufactures
Federal Reserve Bank of Dallas Texas Manufacturing Outlook Survey


