Farm Income’s Impact on the Midwest — A Conference Preview
Agriculture is a vital building block for the economy of the Midwest, producing raw materials for food and biofuels manufacturing, as well as stimulating demand for farm equipment, trucks, and more. Income produced by agricultural operations is a key component of personal income in rural areas. This income from farm households supports businesses on the Main Streets of rural towns. However, there has been a decline in the number of farms over the decades,1 which raises concerns about the role of farm income in the future of the rural Midwest.
On November 17, 2014, the Federal Reserve Bank of Chicago will hold a conference to examine the role of farm income in the Midwest economy. (Check the event page for more details on the conference, including the agenda, and to register.) The conference will explore both the decline in agriculture’s role over the longer term and the marked increase in the level of agricultural income over the past decade. This phenomenon contrasts sharply with the troubled fortunes of the broader economy of the Midwest during and after the Great Recession.
Net farm income is a standard way to measure the size of returns from agricultural operations. Basically, net farm income equals the value of agricultural production and net government transactions minus purchased inputs, capital consumption, and payments to stakeholders.2 The latest U.S. Department of Agriculture forecast of net farm income for 2013 was $131.3 billion for the U.S., an increase of 15% from 2012 and the highest result since 1973 (adjusted for inflation).3 In 2009 dollars, net farm income has averaged $115 billion over the past three years, a level that was previously exceeded only during the period from 1943 to 1948 (going back to 1929). Moreover, the latest decade has seen the highest levels of net farm income since the 1950s, even higher than during the 1970s farm boom. However, net farm income is projected to fall to $113.2 billion for 2014, as crop price decreases will more than offset increased yields from this fall’s harvest.
In addition, net farm income for each state is available through 2012. Using this data, one can estimate the net farm income for the five states of the Seventh Federal Reserve District.4 The District states accounted for 19.5% of U.S. net farm income in 2012 ($22.16 billion). Due to the relatively large role played by farmland rentals in the District, 43% of net rent received by non-operator landlords nationwide was in the District’s states ($6.7 billion). These payments boost the economic impact of agriculture on the District, although some landlords reside outside the region. Another $3.4 billion in 2012 was paid out to hired labor by farms in the District. Furthermore, District agricultural operations spent $26.9 billion on purchased inputs that did not originate on farms. So, the economic benefits of agriculture reach out into communities and the businesses of the District.
Net cash farm income is a somewhat different measure of agriculture’s cash flow.5 It provides helpful information to understand the financial positions of farm operations. Moreover, the 2012 Census of Agriculture provided data on net cash farm income by county.6 Combining this data with personal income by county7 allows computation of the share of personal income generated by net cash farm income. Using these sources to compute a total for just counties in the District, I find the District generated $23.9 billion of net cash farm income in 2012. This represented 1.5% of the District’s total personal income.
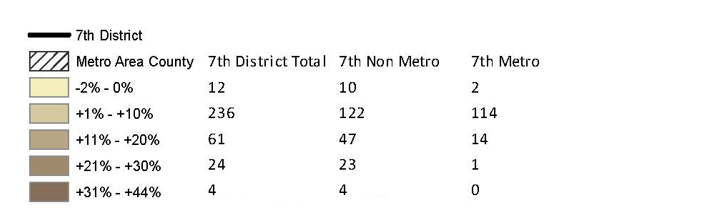
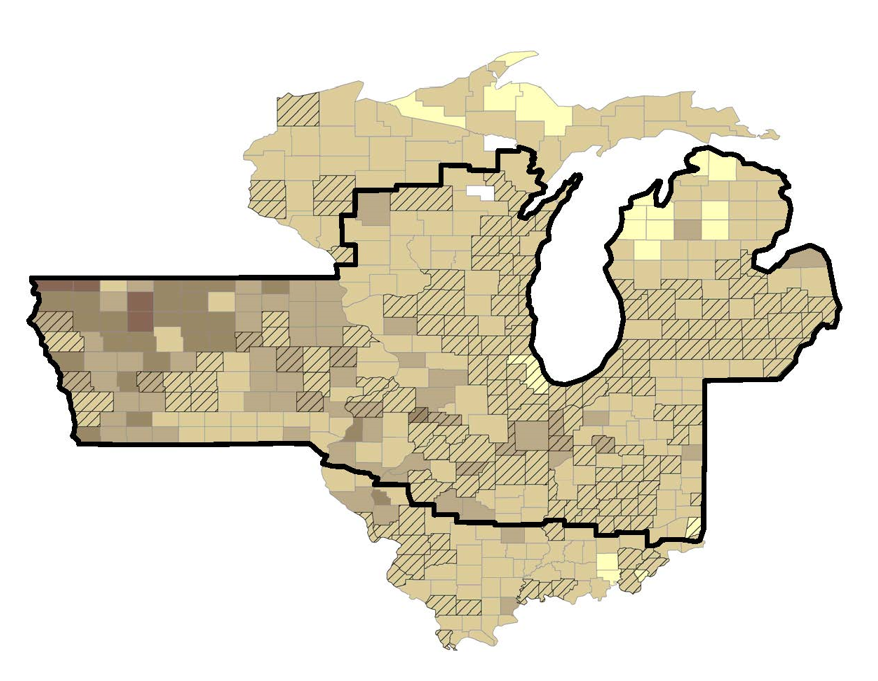
Also, one can categorize counties by how rural they are.8 For the nonmetropolitan counties of the District, $15.96 billion in net cash farm income represented 5.8% of total personal income. For the metropolitan counties of the District, $7.95 billion in net cash farm income represented 0.6% of total personal income. These numbers reinforce the greater dependence of nonmetropolitan counties on agriculture, as one would expect, yet they also demonstrate that even metropolitan counties have significant farm operations. The map below provides the spatial distribution of District counties in terms of the shares of net cash farm income relative to total personal income. Notice that counties in northwest Iowa tend to have the greatest dependence on farming operations, with four having over 30% of personal income from agriculture in 2012.
While such trends and patterns are illuminating, there are many channels between agriculture and the Midwest economy. Please join us on November 17 as experts from academia, government, and business take a deeper dive into Midwest agriculture and its impacts.
1. 7th District percentage of personal income from net farm increase 2012
Footnotes
1 Chart and details are available online.
2 Details are available online.
3 Data is available online.
4 The Seventh Federal Reserve District comprises all of Iowa and most of Illinois, Indiana, Michigan, and Wisconsin.
5 Net cash farm income “represents the amount of cash available to service debt, pay family living expenses, and make investments. It is not a comprehensive measure of profitability, however, since it does not account for changes in inventory, accounts payable, accounts receivable, and depreciation.” Details are available online.
6 Census of Agriculture data are available online for 2012 and earlier.
7 Data under “Local Area Personal Income & Employment” is available online.
8 Details are available online.


