Understanding the Seventh District’s economic slowdown in 2015
As I noted on this blog in February 2015, 2014 was a pretty good year for the Seventh District. Real District gross state product (GSP) grew 1.2%, the unemployment rate fell from 7.3% to 5.8%, and payroll employment grew 1.5%. The strong finish to 2014 led me to feel quite optimistic for how 2015 would turn out. Unfortunately, it has become increasingly clear that economic activity in the Seventh District has steadily slowed as 2015 has progressed. While the District is certainly not in recession, it is now likely growing at a below-trend pace. In this blog post, I provide evidence of the slowdown and explore how the fortunes of District states’ signature industries have both contributed to and helped mitigate the slowdown.
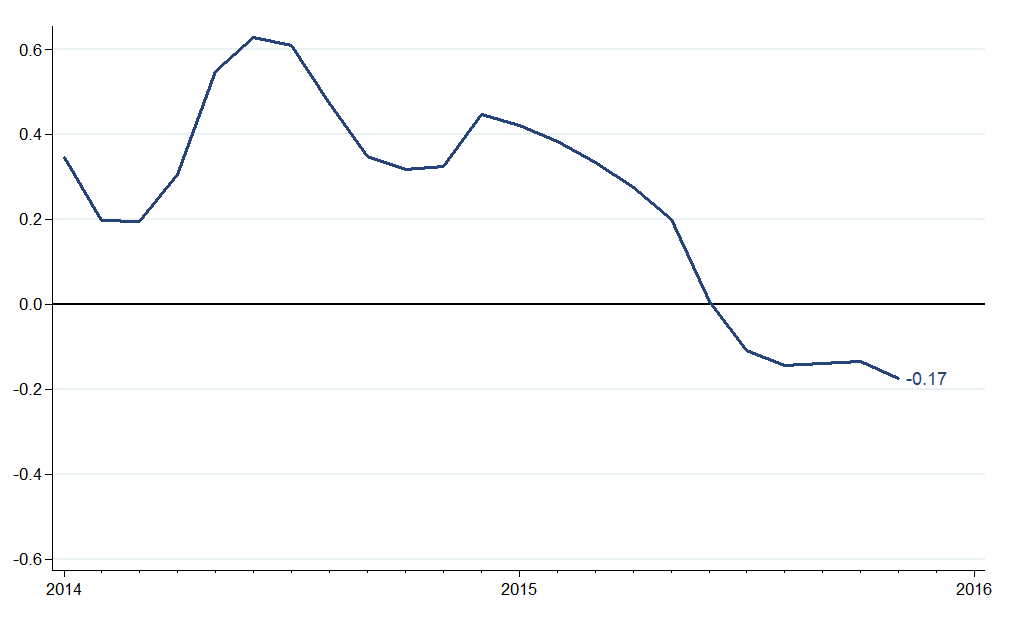
While we wait for the GSP data for 2015 to be released (due out in June), arguably the best overall indicator we have for 2015 District economic activity is our Midwest Economy Index 1 (I should note here that we will be releasing a new survey-based activity index later this month). Figure 1 shows values for the MEI from 2014 to the present. The index was well above zero throughout 2014, indicating that growth was consistently above trend. Just as 2015 began, the index began to decline, and it entered negative territory in June. The most recent reading of the MEI (for November 2015) indicates that District growth is somewhat below trend.
Figure 1. Midwest Economy Index
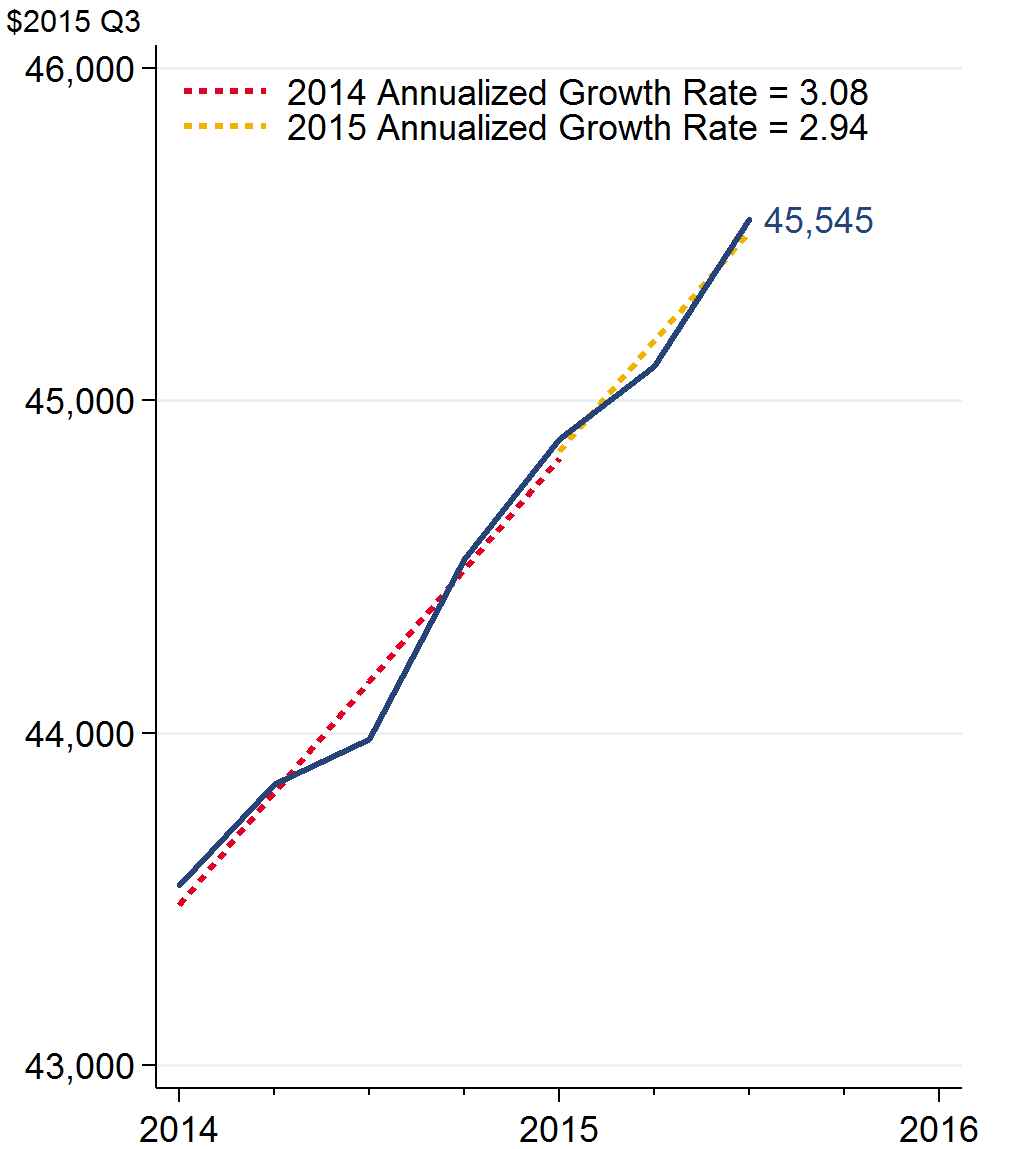
Some important indicators included in the calculation of the MEI are payroll employment, the regional Purchasing Manager Indexes (PMIs) 2, and per capita personal income. Not surprisingly, they also largely suggest that economic activity in the District slowed in 2015. Figure 2 shows that while District payroll employment grew by an average of 23,000 jobs per month in 2014, the pace of growth slowed to only about 12,000 new jobs per month in 2015. Figure 3 shows the simple average of the five PMIs available for the Seventh District. This average also indicates that economic activity declined notably starting in 2015. As a counterpoint, figure 4 shows that the pace of growth in real personal income per capita has not slowed much in 2015: The annualized growth rate for 2014 was 3.08% and the available data for 2015 (through Q3) indicate that the annualized growth rate has only slowed to 2.94%.
Figure 2. Payroll employment
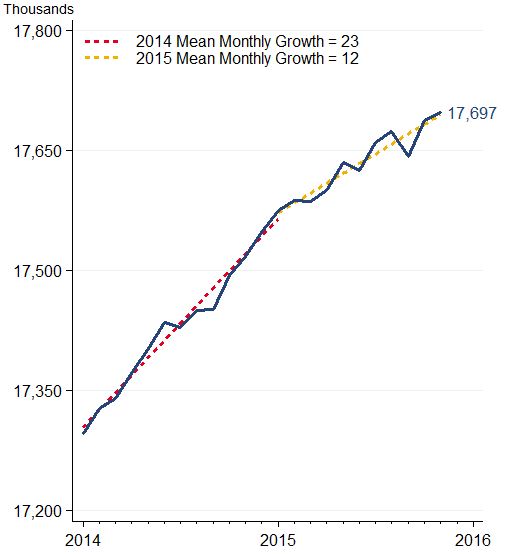
Sources: BLS, Haver Analytics, and author's calculations.
Figure 3. Average of district PMIs
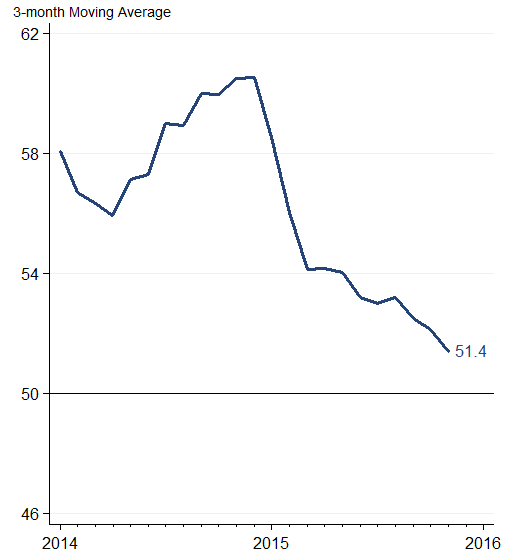
Figure 4. Real personal income per capita
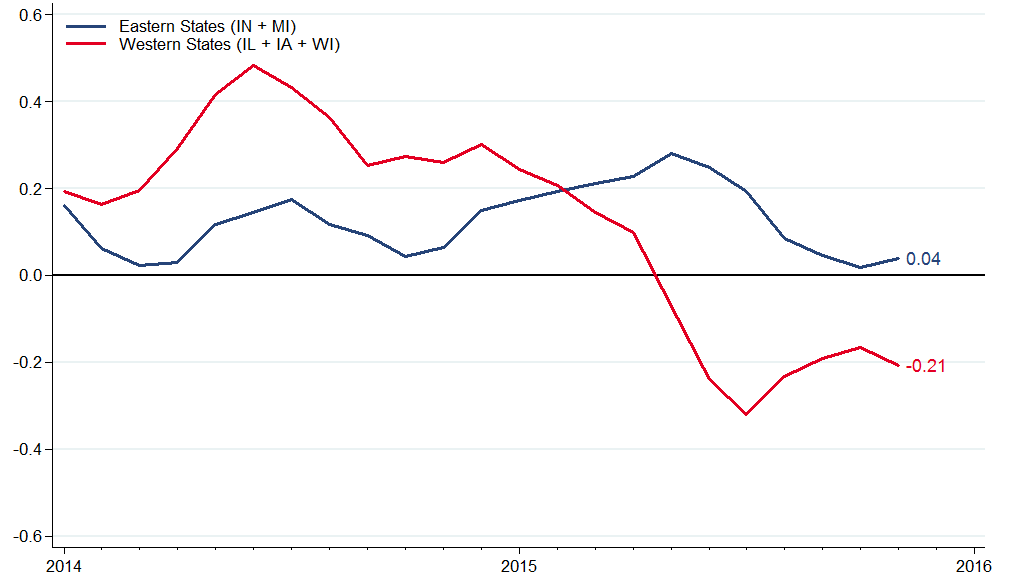
While the preponderance of evidence suggests that Seventh District economic activity slowed in 2015, it turns out that the experiences of individual states within the District have been quite different. Figure 5 shows the sum of the contributions to the MEI for the eastern states of the District (Indiana and Michigan) and the sum for the western states of the District (Illinois, Iowa, and Wisconsin). Growth in 2014 was above the District’s long run trend in both sub-regions, but the western states outperformed the eastern states. The pace of activity in the eastern states picked up steadily through the first half of 2015 and has since slowed to near the District’s trend. This experience contrasts quite notably with that of the western states. Activity in these states began to slow at the end of 2014 and continued to slow until the middle of 2015, at which point conditions improved some.
Figure 5. Eastern vs. western states in the Midwest Economy Index
One approach to understanding the different experiences of eastern and western District states is to do an economic base analysis for each state. Such an analysis identifies the industries whose employment is especially concentrated in a state (and therefore likely quite important for the state’s economy) by calculating a location quotient (LQ). A location quotient is the ratio of the share of employment in an industry in a state to the share of employment in an industry in the U.S. as a whole:

As an example, if the machinery industry’s share of employment in Michigan is 1.3% and the machinery industry’s share of employment in the U.S. is 1%, then the location quotient is 1.3, and we say that the machinery industry is 30% more concentrated in Michigan than in the U.S. as a whole.
For this blog post, I calculate location quotients for each state for each of the 3-digit NAICS industries that are available from the Bureau of Labor Statistics’ (BLS) payroll employment survey.3 I then consider the industries in each state with a location quotient greater than 1.5. This approach successfully identifies the signature industries one typically thinks of for each state in the District. For example, the analysis picks up Michigan’s auto industry, Indiana’s steel industry, and Illinois’s, Iowa’s, and Wisconsin’s machinery industry.
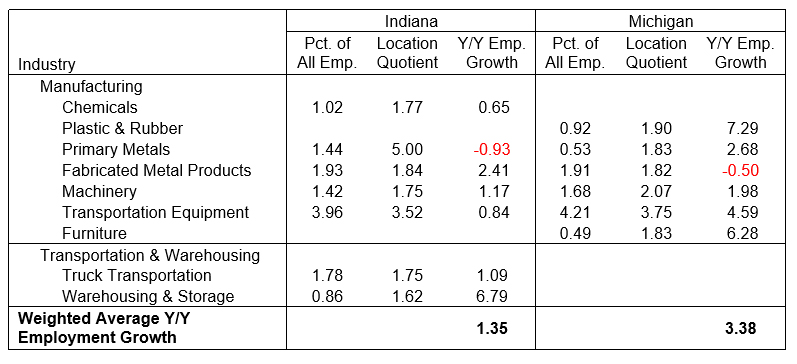
Table 1 shows the high-location quotient industries for Indiana and Michigan, along with the percentage of overall employment the industry represents and the year-over-year employment growth rate of the industry from November 2014 to November 2015. With the exception of the primary metals industry (where employment fell by 0.93%), employment grew for all of Indiana’s high-LQ industries and was solid for most of them. The story is even clearer in Michigan, where the auto industry dominates. Employment in the transportation equipment industry grew 4.59% over the past year.
To summarize the overall growth of District states’ flagship industries, I calculate the average growth rate for the industries, weighted by their relative size. Employment in Indiana’s flagship industries grew 1.35% over the past year, while employment in Michigan’s flagship industries grew 3.38%. Thus, even though the pace of growth in economic activity slowed in Indiana and Michigan in the second half of 2015, it was still a good year for both states.
Table 1. Analysis of high-location quotient industries for eastern district states
Sources: BLS, Haver Analytics, and author's calculations.
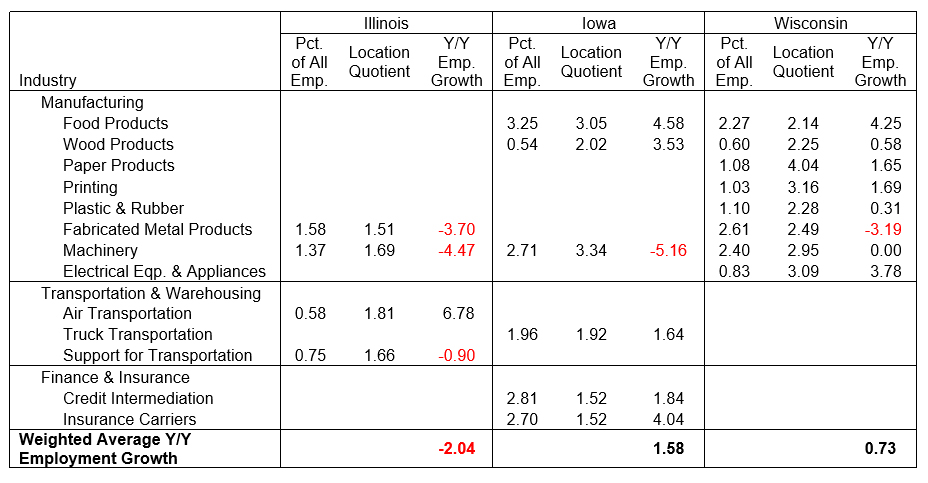
The story is more mixed for the states in the western part of the District (table 2). Machinery (and the fabricated metal producers who support them) has not faired well in the past year: Illinois, Iowa, and Wisconsin all saw notable declines in machinery and fabricated metal employment (with the exception of Wisconsin’s machinery employment, which was flat). However, Iowa and Wisconsin were helped by strong growth in other flagship industries (food products in both Iowa and Wisconsin and finance in Iowa). Illinois has few other flagship industries to help it, though it’s worth noting that Chicago has fared much better than downstate Illinois because of its concentration in business services and finance. Average employment growth for Illinois’s high-LQ industries was dismal (-2.04%), while growth was solid for Iowa’s (1.58%), and slow for Wisconsin’s (0.73%). Thus, although some flagship industries have done well in the western states in the District, the struggles of the machinery industry appear to have put quite a damper on their economic performance.
Table 2. Analysis of high-location quotient industries for western district states
Sources: BLS, Haver Analytics, and author's calculations.
So we see that the overall slowdown in the District in 2015 was not a shared experience across District states. The eastern states (Michigan and Indiana) did notably better than the western states (Illinois, Iowa, and Wisconsin) and these differences are relatively consistent with the performance of states’ flagship industries. What does the future hold for these flagship industries? At the moment, it’s hard to find much evidence that there will be a significant reversal of fortunes in 2016. The auto industry is likely to continue to benefit from steady growth in the U.S. economy and low gasoline prices, while the machinery industry is likely to continue to suffer from weaker global growth and depressed commodities prices (which hurt demand for both mining and agriculture machinery).
That said, while flagship industries certainly play an important role in a state’s economy because of all the related industries that support them, there are still many industries that are not closely related to them. For example, Iowa’s contribution to the MEI has been negative for most of 2015 (not shown), likely because of the struggles in the farming industry (see the Chicago Fed’s latest AgLetter for more details). The converging trends in the MEI (figure 5) suggest that these other factors are also making their presence known.
1 The MEI is a weighted average of 129 Seventh District state and regional indicators measuring growth in nonfarm business activity from four broad sectors of the Midwest economy: manufacturing, construction and mining, services, and consumer spending.
2 The PMIs included in the index are for Chicago, Iowa, Detroit, and Milwaukee.
3 Data are not available for all 3-digit NAICS industries because there is not sufficient employment in some industries in some states for the BLS to be able to cover them accurately.


