First Half Review—A Good Year So Far for the Seventh District
Summary: We now have data through the first half of 2018, and they indicate that the Seventh Federal Reserve District’s economy did quite well. The manufacturing sector is the primary source of the good performance—growth has been strong enough that there are now signs of some manufacturers running into capacity constraints. While the nonmanufacturing sectors are not running as hot as the manufacturing sector, they still have had a fine year so far. Positive outlooks for both U.S. growth and global growth suggest that the District’s economy will continue to do quite well in the near term. That said, respondents to the Chicago Fed Survey of Business Conditions (CFSBC) are getting more and more worried about the potential negative impacts of an escalating trade war.
Now let’s look at the economic indicators that support this analysis.
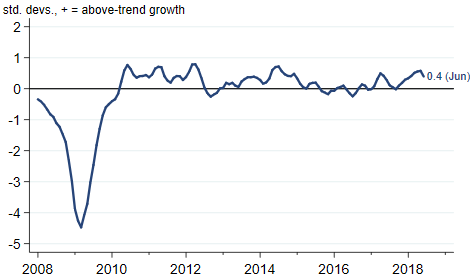
The Midwest Economy Index (MEI), which summarizes over 100 state and regional economic indicators for the Seventh District, shows that the pace of growth has been comfortably above trend for all of 2018 (figure 1).
1. Midwest Economy Index
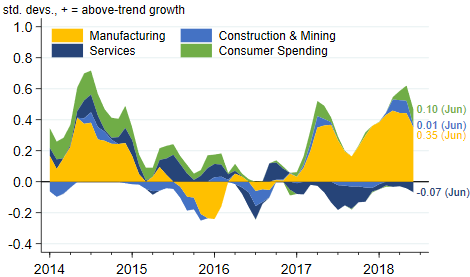
If we look at the sectors that make up the MEI (figure 2), we can see that the success of the manufacturing sector almost entirely explains why the MEI has been so positive. The remaining three sectors are all at about their respective long-term growth rates.
2. Midwest Economy INdex sectoral contributions
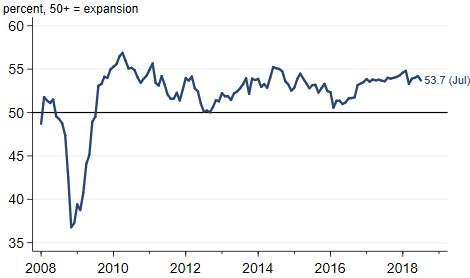
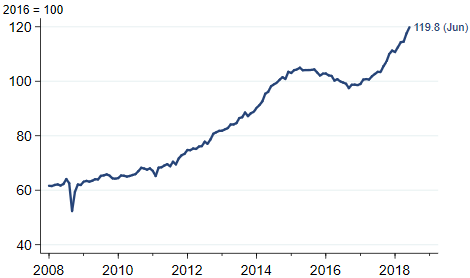
Why has manufacturing done so well? As I’ve been noting for a while now, widespread growth across the world and rising output from the oil and gas industry in the U.S. continue to create solid growth in demand for the District’s manufactured goods. The July reading of the J. P. Morgan Global Manufacturing & Services PMI (purchasing managers’ index) indicates that global growth remains solidly in expansion territory (figure 3). Meanwhile, U.S. oil and gas production continues to trend strongly upward (figure 4), with output in June of this year nearly 20 percent higher than the average output for 2016.
3. J.P. Morgan Global Manufacturing & Services PMI
4. Industrial production index for oil and gas extraction
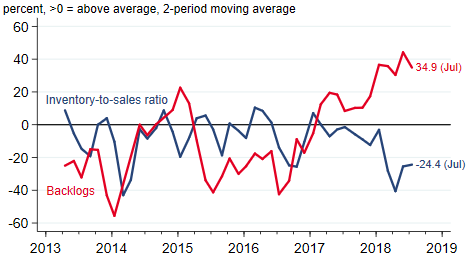
Strong demand for manufactured goods has led to an increasing number of reports from our CFSBC respondents of capacity constraints. In the CFSBC, we ask our manufacturing contacts about their inventory-to-sales ratio and the size of their order backlogs.1 Figure 5 shows that, starting in early 2018, more contacts have been reporting shrinking inventories and increasing backlogs, to the point that the backlog index is at its highest level since 2013 and the inventories index is near its lowest. And, as we’ve noted in recent editions of the Beige Book, manufacturers have been reporting longer lead times for receiving newly purchased capital equipment. Over time, capacity constraints should lead firms to increase some combination of employment, capital spending, and prices.
5. CFSBC indexes of manufacturers' inventories and backlogs
Source: Federal Reserve Bank of Chicago
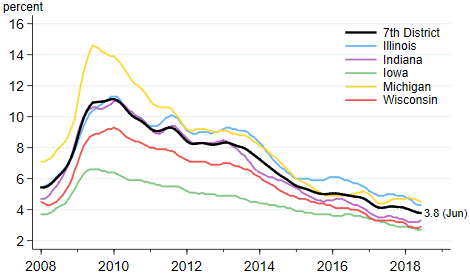
Given the overall strength of the Seventh District economy, it is no surprise that the labor market is also in good shape. Unemployment rates are low across all five District states (figure 6), and the District’s overall rate is the lowest it’s been since 2000. Most other measures of labor market conditions tell a similar story.
6. Unemployment ates for Seventh District states
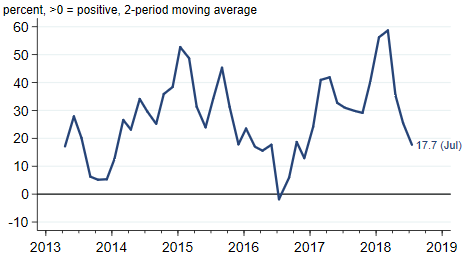
One dark cloud in an overall bright picture is the potential for the Trump administration’s trade war to slow domestic and global growth. Our CFSBC contacts have expressed increasing concern about this possibility, which has contributed to declines in the CFSBC Outlook Index (figure 7). The index shows that most of our contacts were optimistic in their respective outlooks for the U.S. economy following the passage of the federal tax cut in December 2017, but that this optimism has faded since then. Comments from respondents indicate that the declines are largely the result of trade war concerns. It is quite difficult to forecast the impacts of a trade war, given the complexity of global trade linkages. That said, elevated trade policy uncertainty is making our business contacts feel more cautious.
7. CFSBC 6—12 Month Outlook Index
Source: Federal Reserve Bank of Chicago
In spite of the trade concerns, 2018 has been a very positive year for the District so far, and there’s a good chance that the economic conditions from the first half of the year will prevail through the second half.
Footnotes
1 We do not currently publish these indexes as part of the regular CFSBC release.


