Mid-Winter Review—Economic Activity in the Seventh District Picked Up After a Bit of a Lull
Summary
The Seventh District economy maintained a healthy pace of growth through the end of 2017 and into January, with most signs pointing toward above-trend growth. The manufacturing sector finished 2017 well, with good news spread across its subsectors. And it’s worth noting that while the auto industry struggled in the middle of the year, it ended the year in decent shape. Outside of manufacturing, most sectors continued to experience slow but steady growth. Positive outlooks for global growth and the energy sector suggest the Midwest economy is well positioned for a good start to 2018. In addition, as noted in an earlier post, our Chicago Fed Survey of Business Conditions (CFSBC) contacts expect a boost from the federal tax reform (though it is not clear how strong the boost will be).
Now let’s look at the economic indicators that support this analysis.
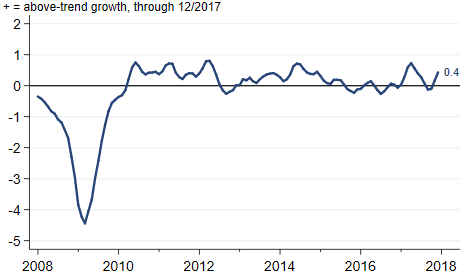
The December Midwest Economy Index (MEI), which summarizes over 100 state and regional economic indicators for the District, indicates that the pace of growth picked up in the final quarter of 2017 after a summer lull (figure 1).
1. Midwest Economy Index
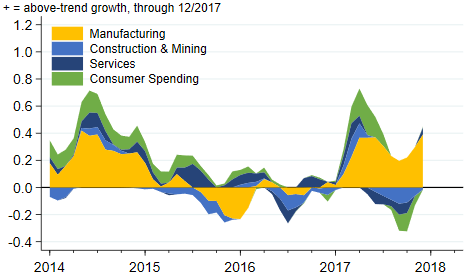
If we look at the sectors that make up the MEI, we can see that manufacturing had a very good 2017, with growth consistently registering at an above-trend rate. While all of the MEI sectors experienced a lull in the summer of 2017, the drop was more substantial for the three nonmanufacturing sectors. But all three returned to trend growth by the end of the year.
2. MEI sectoral contributions
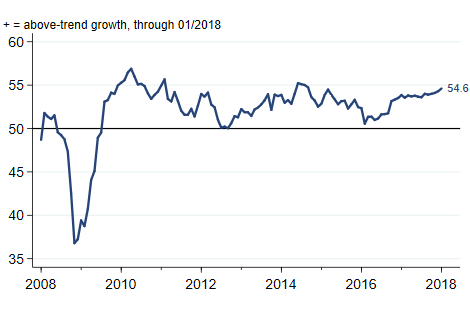
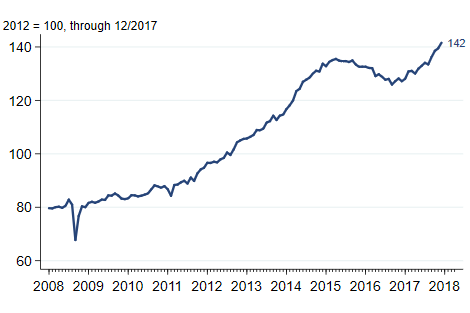
As I’ve been noting for a while, widespread growth across the world and rising output in the oil and gas industry continued to support District manufacturers. The October reading of the J.P. Morgan Global Manufacturing & Services PMI (purchasing managers’ index) indicated global growth remained solidly in expansion territory (figure 3). Meanwhile, U.S. oil and gas production continued to trend upward (figure 4).
3. J.P. Morgan global manufacturing & services PMI
4. Industrial production index of oil and gas extraction
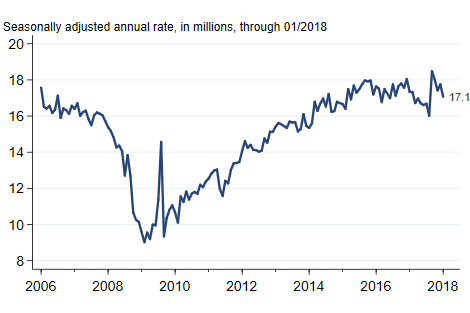
After a difficult summer, the auto industry had good sales numbers to end the year (figure 5). Forecasters generally expect 2018 sales to be slightly below 17 million light vehicle units, which is lower than the 17.1 million units that were sold in 2017. Thus, while it is unlikely that the auto industry will be a major growth driver for the District this year (and next), most expect the industry to maintain a respectable level of activity.
5. Light vehicle sales
In spite of recent stock market jitters, there is little that would suggest solid growth won’t continue through the beginning of 2018.


