First Quarter 2019 Review—Slower, but Respectable Growth
Summary
Growth in the Seventh Federal Reserve District is near its long-term trend, after steadily slowing from a strong rate over the past nine months. The deceleration in growth occurred in both the manufacturing and nonmanufacturing sectors. But while activity is slower compared with a year ago, the economy is still growing at a respectable pace, and conditions in the labor market remain very good. In addition, our business contacts’ outlooks have picked up some.
Now let’s look at some economic indicators that support this analysis.
We start with two indicators of overall economic activity for the Seventh Federal Reserve District—namely, our Midwest Economy Index (MEI) and the Chicago Fed Survey of Business Conditions (CFSBC) Activity Index. The MEI summarizes more than 100 economic indicators for the five Seventh District states (Illinois, Indiana, Iowa, Michigan, and Wisconsin). The CFSBC Activity Index summarizes about 100 responses from business leaders in the Seventh District to a survey question about product demand. In spite of using very different information sources, the indexes track each other very closely. Figure 1 shows the MEI and CFSBC Activity Index together. For this figure, I’ve transformed the CFSBC Activity Index to match the timing and scale of the MEI. While the indexes usually tell a similar story, the latest MEI reading is noticeably higher than the latest CFSBC Activity Index reading. What should we make of this discrepancy?
One plausible explanation for this difference is based on how the MEI is constructed. The MEI is calculated from state-level data that are noisy, so we smooth the index using a three-month moving average. For example, this means that the latest reading of the MEI (released at the end of April) is based on data for January, February, and March. It turns out that the January data were unusually strong—so much so that they make up for weaker February and March data. So unless the April data are unusually strong like the January data were, it is likely that the April MEI will move down.
All this is to say that the CFSBC Activity Index is likely closer to reality than the MEI—which suggests Seventh District growth has slowed to around its long-run trend.
1. MEI and transformed CFSBC Activity Index
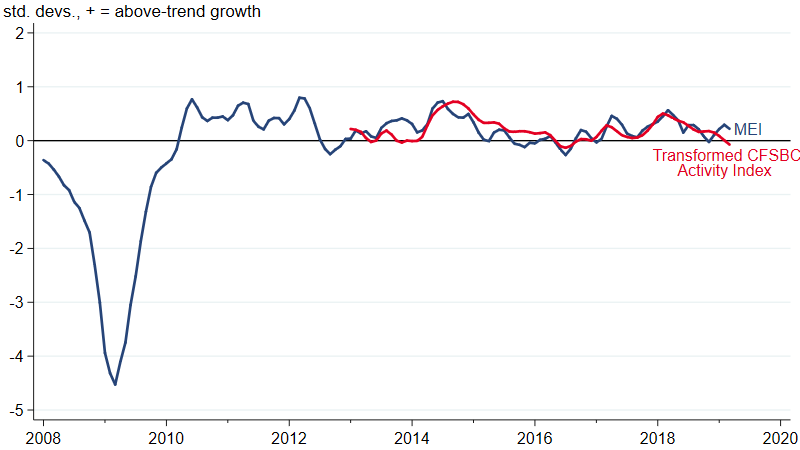
Source: Author’s calculations based on data from the Federal Reserve Bank of Chicago.
In a typical Seventh District update, we would now turn to what the MEI indicates is going on in specific industrial sectors. But because the CFSBC Activity Index is likely closer to reality, this time we’re going to look at what it can tell us. The CFSBC Activity Index can’t get as specific as the MEI, but it’s still possible to classify contacts as those from the manufacturing sector or nonmanufacturing sector. Figure 2 shows indexes for the two sectors, where, as in figure 1, I’ve transformed them to match the timing and scale of the MEI. The two indexes generally track each other pretty closely, though there are some differences. For example, 2017 and 2018 were especially good for the manufacturing sector. More recently, both indexes have moved down and now indicate that growth is slightly below trend in both sectors.
2. CFSBC Manufacturing and Nonmanufacturing Activity Indexes (transformed)

Source: Authors’ calculations based on data from the Federal Reserve Bank of Chicago
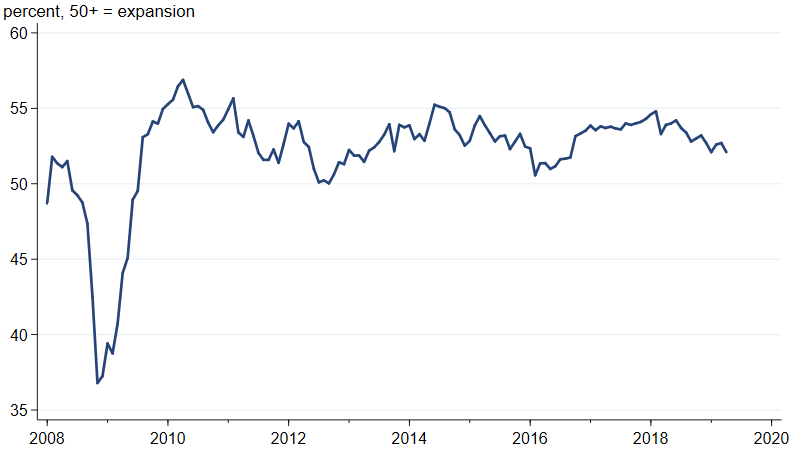
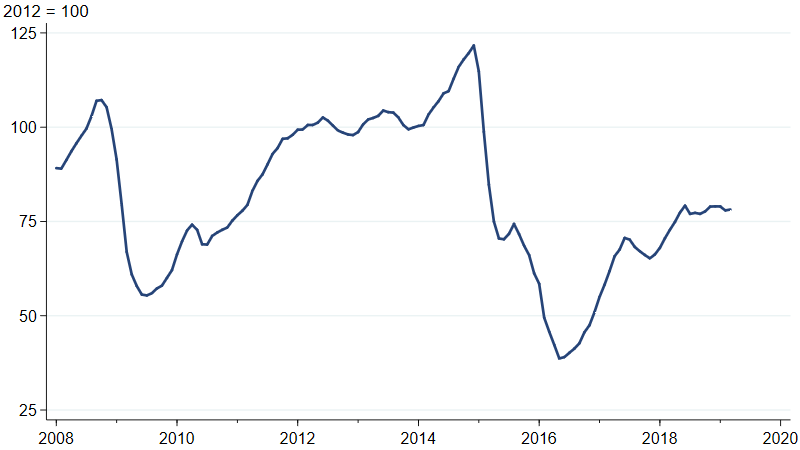
What can explain the slowdown over the past 9 months? As I’ve been noting for a while now, slower growth in the U.S. and across the world, combined with flat activity in the U.S. oil and gas industry, has resulted in slower growth in demand for the District’s manufactured goods. The J. P. Morgan Global Manufacturing & Services PMI (purchasing managers’ index) indicates that the pace of global growth started slowing in the second half of 2018 (figure 3). Meanwhile, oil and gas well drilling activity has been flat since May 2018 (figure 4). The timing of both of these developments is closely aligned with the decline we’ve seen in the CFSBC activity indexes.
3. J. P. Morgan Global Manufacturing and Services PMI
4. Industrial production index for drilling oil and gas wells
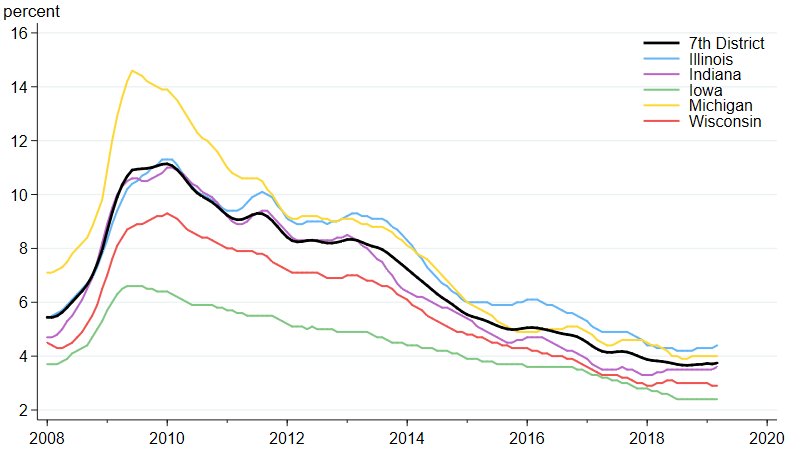
While the Seventh District’s growth has slowed, the economy is still in good shape, and labor market conditions reflect that. Unemployment rates are low across all five District states (figure 5). Moreover, after years of disappointing numbers following the Great Recession, wage growth appears to be picking up in the Seventh District and the U.S. as a whole (figure 6). Compared with a year ago, the 12-month moving average of average hourly wages is 3.7% higher for Seventh District states and 3.2% higher for the nation. This measure of Seventh District wage growth is the highest it’s been since the U.S. Bureau of Labor Statistics started producing it in 2008.
5. Unemployment rates for Seventh District states
6. Average hourly earnings for the Seventh District and the U.S.
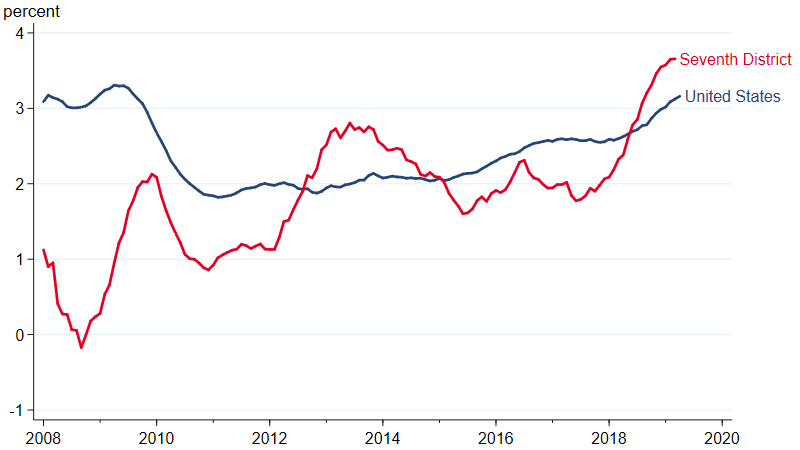
Source: U.S. Bureau of Labor Statistics data from Haver Analytics.
The slowdown in the economy over the past nine months led to a deterioration in business sentiment, as measured by the CFSBC’s Outlook Index. Figure 7 shows that the index moved into negative territory at the start of 2019, which means that more survey respondents were feeling pessimistic than optimistic about the prospects for U.S. economic growth over the next six to 12 months. The index has recovered more recently—which suggests that our business contacts do not expect the economy to slow much more than it already has.
7. CFSBC Outlook Index
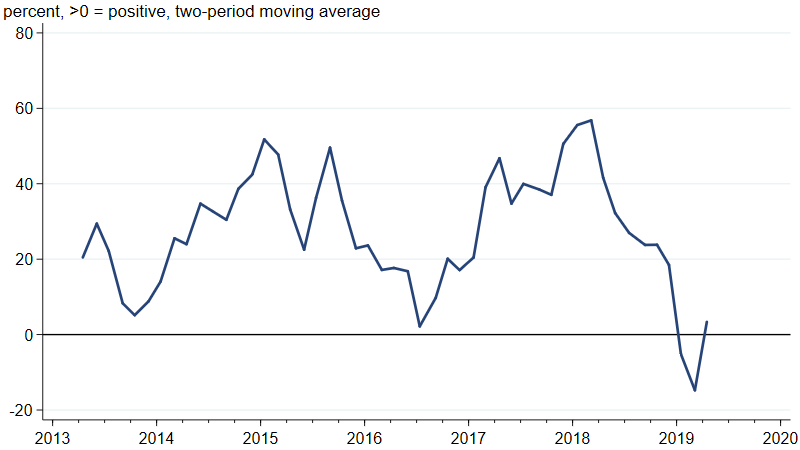
Source: Federal Reserve Bank of Chicago.
Conclusion
The Seventh District’s pace of economic growth is clearly slower than a year ago, but the growth rate is still pretty good, and the labor market is doing very well. Our business contacts’ outlooks have stabilized, suggesting that they do not expect growth to slow much further.


