Fourth Quarter 2018 Review—Growth Continued to Slow, but Remained Solid
Recently, companies from China have begun to explore direct investments in the Midwest and elsewhere around the world. Direct investment differs from portfolio investment, such as investment in U.S. Treasuries, in that direct investors
Summary
Growth in the Seventh Federal Reserve District continued to slow through the end of 2018, and the data indicate that the pace decelerated from well above trend to right around trend. The slowdown is primarily in the manufacturing sector, where growth was clearly stronger in the first half of 2018. Even so, the deceleration—combined with greater turmoil in the financial markets and Washington—is weighing on outlooks. According to the latest Chicago Fed Survey of Business Conditions (CFSBC) Outlook Index, our business contacts are as pessimistic as they’ve been since we started the survey five years ago. In spite of the slowdown in activity and more pessimistic outlooks, it’s still reasonable to think that 2019 will be a decent year for the District’s economy. That said, the District’s economic performance in 2019 is not likely to outpace its performance last year.
Now let’s look at the economic indicators that support this analysis.
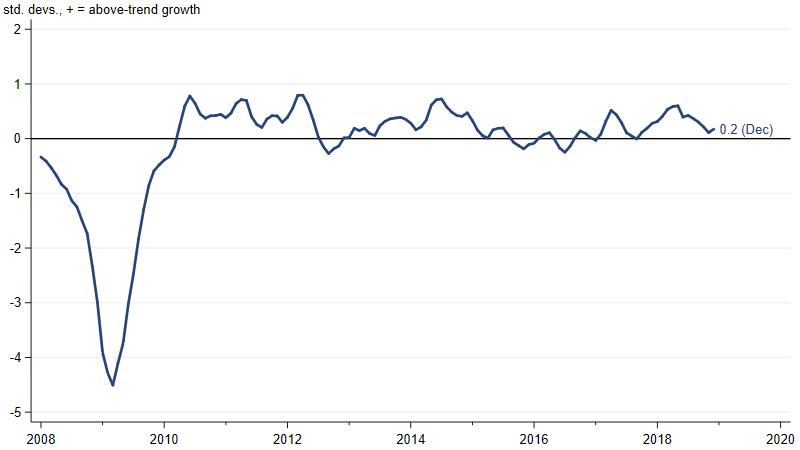
The Midwest Economy Index (MEI), which summarizes more than 100 state and regional economic indicators for the Seventh District states, shows that growth started trending down in June 2018, but remains slightly above trend.
1. Midwest Economy Index
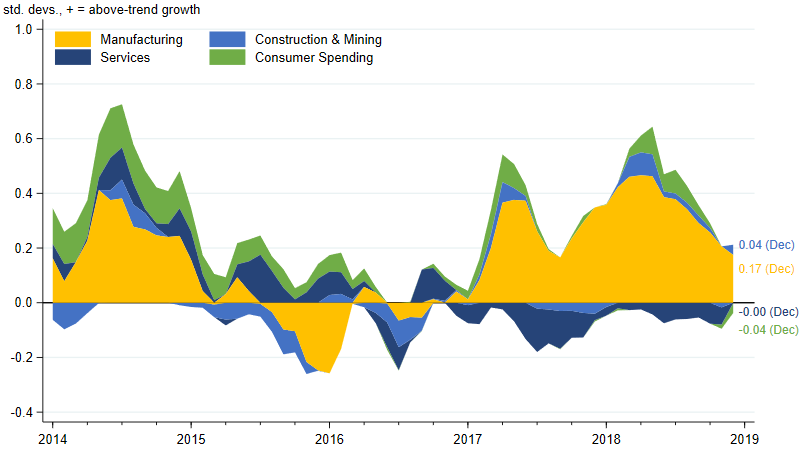
If we look at the contributions from the sectors that make up the MEI (figure 2), we can see that the manufacturing sector almost entirely explains why the MEI moved up in the first half of 2018 and then moved down in the second half. Contributions from the remaining three sectors were all at about their long-term growth rates throughout 2018.
2. Midwest Economy Index sectoral contributions
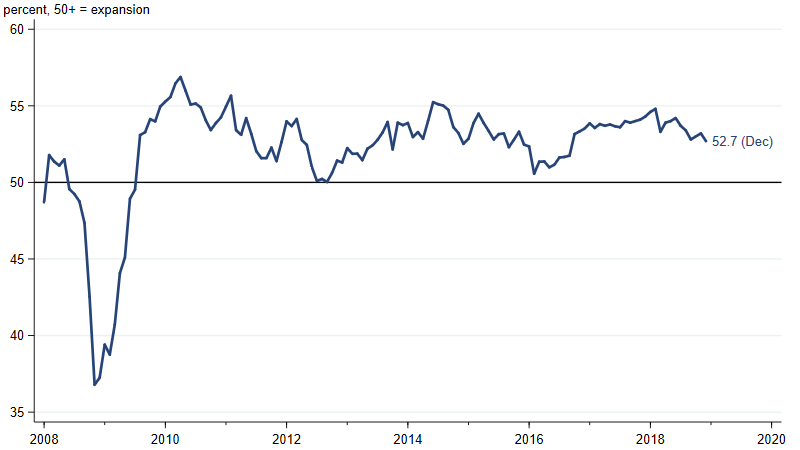
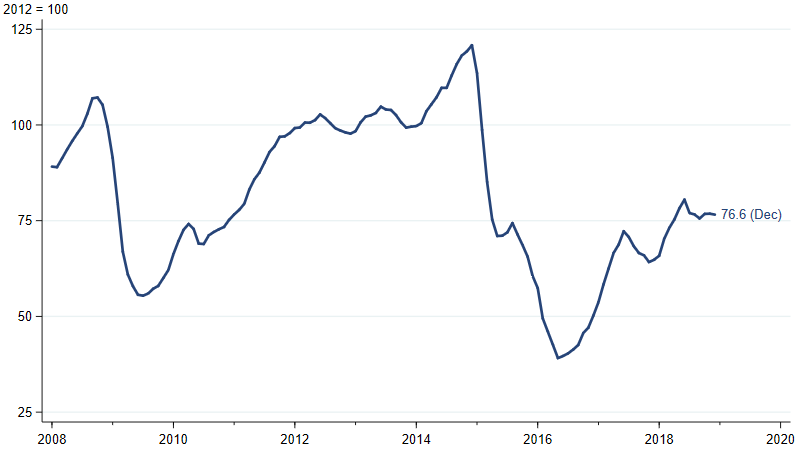
What can explain the changes in the pace of manufacturing activity? As I’ve been noting for a while now, solid growth in the U.S. and across the world, combined with strong activity in the U.S. oil and gas industry, has resulted in increased demand for the District’s manufactured goods. Recently, though, global growth appears to have slowed some. In addition, U.S. oil and gas production has taken a pause in response to falling oil prices. The J. P. Morgan Global Manufacturing & Services PMI (purchasing managers’ index) indicates that, like the MEI, the pace of global growth likely peaked in the first half of 2018 (figure 3). Meanwhile, the drilling of oil and gas wells has been flat since May 2018, after trending strongly upward for a year and a half (figure 4).
3. J. P. Morgan Global Manufacturing and Services PMI
4. Industrial production index for drilling oil and gas wells
Along with the slowdown in the MEI, there’s been a deterioration in business sentiment, as measured by the CFSBC’s Outlook Index (figure 5). The index recently moved into negative territory, which means that more survey respondents are feeling pessimistic than optimistic about the prospects for U.S. economic growth over the next six to 12 months. The latest CFSBC release notes that the sources of pessimism are increased financial market volatility; elevated policy uncertainty related to trade negotiations and the government shutdown; and slowing demand for respondents’ firms’ products.
5. CFSBC Outlook Index
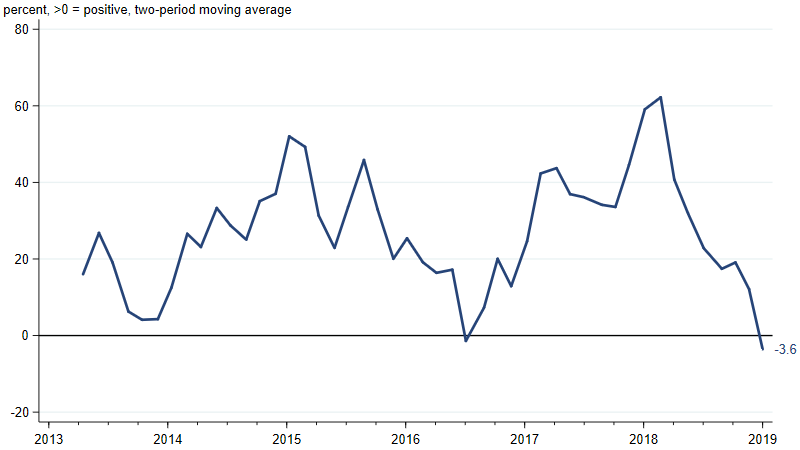
Source: Federal Reserve Bank of Chicago.
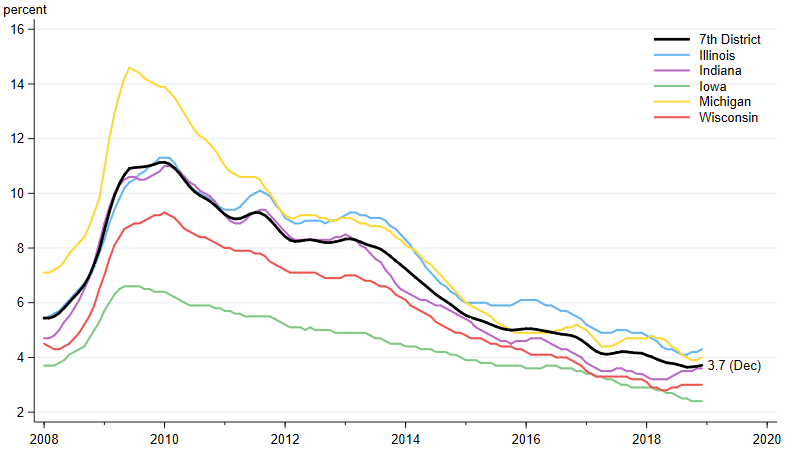
While the Seventh District’s growth has slowed and our business contacts are a bit worried, the overall economy is still in good shape, and labor market conditions reflect that. Unemployment rates are low across all five District states (figure 6). Moreover, after years of disappointing numbers following the Great Recession, it appears that wage growth is picking up in the Seventh District and the U.S. as a whole (figure 7). Compared with a year ago, the 12-month moving average of average hourly wages is 3.5% higher for Seventh District states and 3.0% higher for the nation. This measure of Seventh District states’ wage growth is the highest it’s been since the U.S. Bureau of Labor Statistics started producing it in 2008.
6. Unemployment rates for Seventh District states
7. Average Hourly Earnings
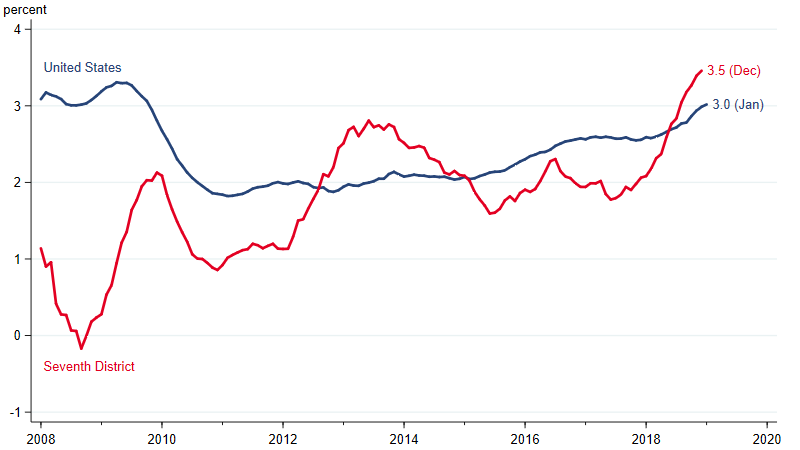
Source: U.S. Bureau of Labor Statistics data from Haver Analytics.
Conclusion
The Seventh District’s pace of economic growth continued to slow in the fourth quarter of 2018, and it’s now close to its long-run trend. In spite of increased pessimism from business leaders, the fundamental measures of activity are still in fine shape, suggesting 2019 will be another good year for the District.


