Second Quarter 2019 Review—Growth Continued to Slow and Is Now Below Trend
Summary
Growth in the Seventh Federal Reserve District continued to slow in the second quarter of 2019, and the pace is now moderately below trend. Growth slowed across all sectors, but the slowdown was particularly noticeable in the manufacturing and service sectors. In spite of the slowdown, our business contacts expect the economy to continue to grow over the coming year.
Now let’s look at some economic indicators that support this summary.
Analysis
We start with two indicators of overall economic activity for the Seventh Federal Reserve District—namely, our Midwest Economy Index (MEI) and the Chicago Fed Survey of Business Conditions (CFSBC) Activity Index. The MEI summarizes more than 100 economic indicators for the five Seventh District states (Illinois, Indiana, Iowa, Michigan, and Wisconsin). The CFSBC Activity Index summarizes about 100 responses from business leaders in the Seventh District to a survey question about product demand. In spite of using very different information sources, the indexes track each other closely. Figure 1 shows the MEI and CFSBC Activity Index together. For this figure, I’ve transformed the CFSBC Activity Index to match the timing and scale of the MEI. Both indexes indicate that growth has slowed and is now moderately below trend.
1. MEI and transformed CFSBC Activity Index
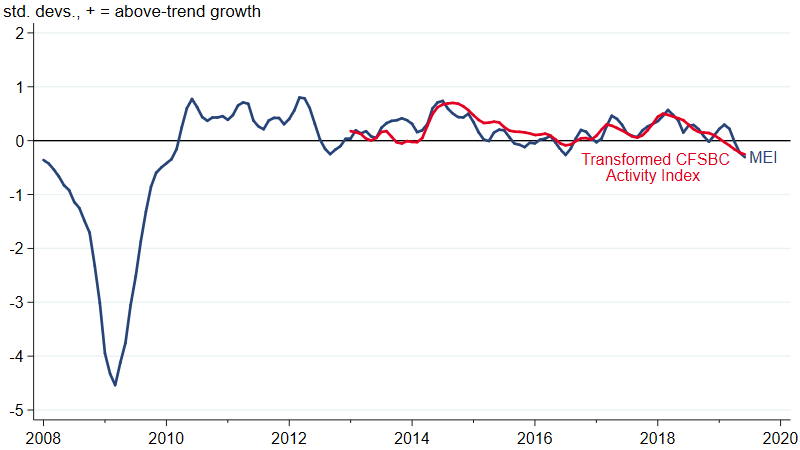
Source: Author’s calculations based on data from the Federal Reserve Bank of Chicago.
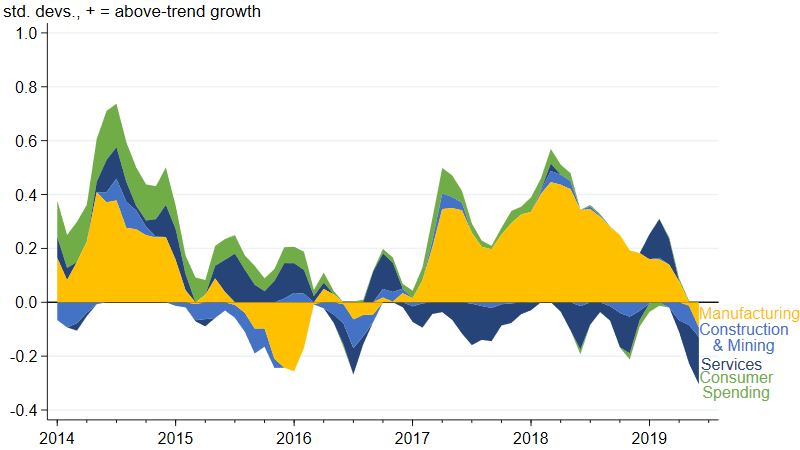
If we look at the contributions from the sectors that make up the MEI (figure 2), we can see that growth has slowed for all sectors—with the largest declines in growth in the manufacturing and service sectors. Manufacturing activity has slowed considerably since the middle of 2018.
2. Midwest Economy Index sectoral contributions
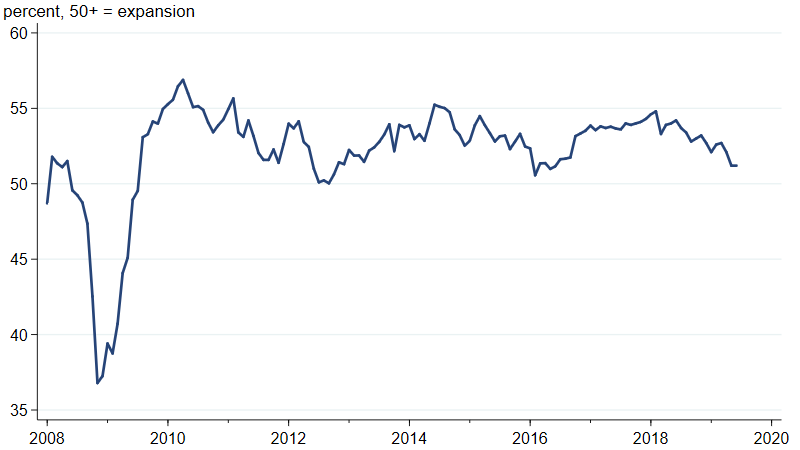
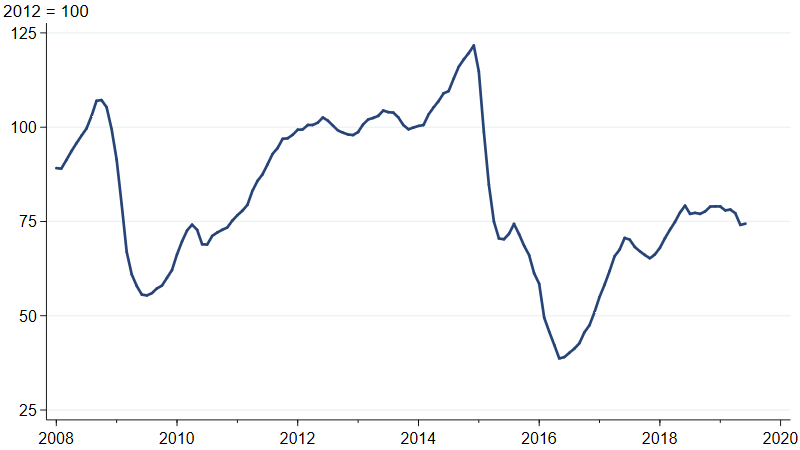
What can explain the slowdown in Seventh District activity over the past year? As I’ve been noting for a while now, slower growth in the U.S. and across the world, combined with flat activity in the U.S. oil and gas industry, has resulted in slower growth in demand for the District’s manufactured goods. The J. P. Morgan Global Manufacturing & Services PMI (purchasing managers’ index) indicates that the pace of global growth started slowing in the second half of 2018 (figure 3). Meanwhile, oil and gas well drilling activity has been flat since May 2018 (figure 4). The timing of both of these developments is closely aligned with the decline we’ve seen in the MEI and CFSBC Activity Index.
3. J. P. Morgan Global Manufacturing and Services PMI
4. Industrial production index for drilling oil and gas wells
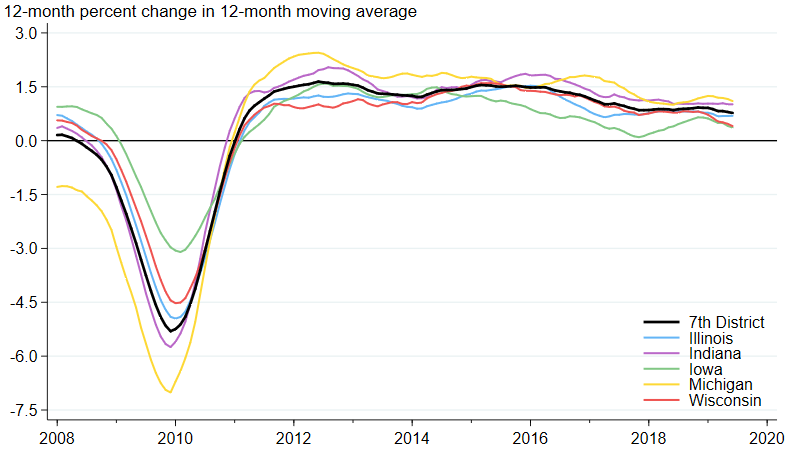
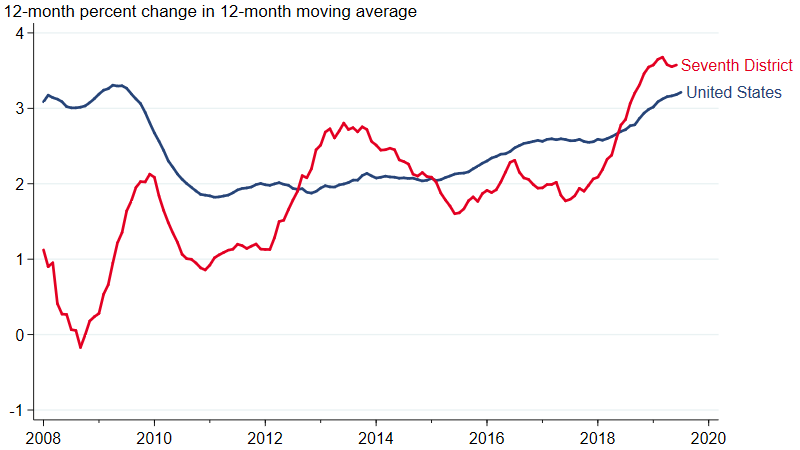
While the Seventh District’s growth has fallen below trend, the labor market is still in very good shape. Employment continues to grow across all five District states (figure 5). Moreover, after years of disappointing numbers following the Great Recession, wage growth has picked up in the Seventh District and the United States as a whole (figure 6). Compared with a year ago, the 12-month moving average of average hourly earnings is 3.6% higher for Seventh District states and 3.2% higher for the nation. This measure of Seventh District wage growth is around the highest it’s been since the U.S. Bureau of Labor Statistics started producing state-level measures in 2008.
5. Employment growth rates for Seventh District states
6. Average hourly earnings growth for the Seventh District and the U.S.
The slowdown in the economy over the past year led to a deterioration in business sentiment, as measured by the CFSBC’s Outlook Index. Figure 7 shows that the index moved into negative territory at the start of 2019, which means that more survey respondents were feeling pessimistic than optimistic about the prospects for U.S. economic growth over the next 12 months. The index has recovered more recently—which suggests that our business contacts do not expect the economy to slow much more than it already has. Another sign that our contacts’ outlooks are stable in spite of the slowdown in growth comes from the CFSBC’s question on their expected change in product demand over the next 12 months. Figure 8 shows the distribution of their responses. Almost two-thirds of the nonmanufacturing contacts expect demand to grow, and in spite of their current struggles, about half of the manufacturing contacts expect growth in demand as well.
7. CFSBC Outlook Index

Source: Federal Reserve Bank of Chicago.
8. Responses to CFSBC question concerning expected change in demand over next 12 months as of 7/17/2019

Source: Federal Reserve Bank of Chicago.
Conclusion
The Seventh District’s pace of economic growth has slowed considerably from a year ago, and it’s now moderately below trend. That said, the labor market continues to do well. And our business contacts’ outlooks are stable, suggesting that they do not expect growth to slow much further.


