How Much Has the Employment Response to the Covid-19 Pandemic Differed Across States?
The Covid-19 pandemic has caused a worldwide economic downturn. While the decline in economic activity has been substantial everywhere, within the U.S., the magnitudes of both the initial downturn and ongoing recovery have varied by state. In this blog post, I review the employment experiences of U.S. states since the onset of the pandemic, and I pay special attention to states in the Federal Reserve’s Seventh District—Illinois, Indiana, Iowa, Michigan, and Wisconsin.1 In a subsequent post, I will explore some explanations for why states have had different experiences.
There are a number of ways to measure a state’s economic performance, including many new high-frequency data sources, which are released on a weekly or even daily basis. For this post, however, I rely on a long-standing monthly measure from the U.S. Bureau of Labor Statistics: nonfarm payroll employment. The frequency of this data series is high enough to capture the massive drop in employment that occurred over the course of just two months (March and April) during the spring of 2020. And while these payroll data are known to have accuracy issues that I discuss in a previous post and working paper, we can still expect them to be at least as comprehensive as other available monthly measures.
Figure 1 shows an index of employment from January through November 2020 for the U.S. as a whole, the Seventh District, and the 50 individual states (plus the District of Columbia). For this figure, the employment level in February 2020 is set to 100 for the nation, the Seventh District, and the states. In the figure, each of the light gray lines represents a different state. The Covid-19 pandemic had a swift and massive impact on employment everywhere: In April the index value for the U.S. was 85, which means employment dropped by 15% in just two months. The index value for the Seventh District was 84 at that time. But just two months after employment started declining, it started to rise—quite rapidly at first and then at a much slower pace more recently. (In fact, employment in the Seventh District ticked down from October to November.) As of November, both the U.S. and Seventh District had recovered a little over half of the employment they had lost last spring: The index value of the nation hit 94, and index value of the Seventh District stood at 93. The overall employment experiences of the U.S. and Seventh District have been quite similar. Yet, the values for these two larger geographic regions mask important differences in the employment experiences across various states during 2020. The wide dispersion of the light gray lines in figure 1 makes this clear for the U.S.
1. Nonfarm payroll employment index for the U.S., Seventh Federal Reserve District, and U.S. states, 2020
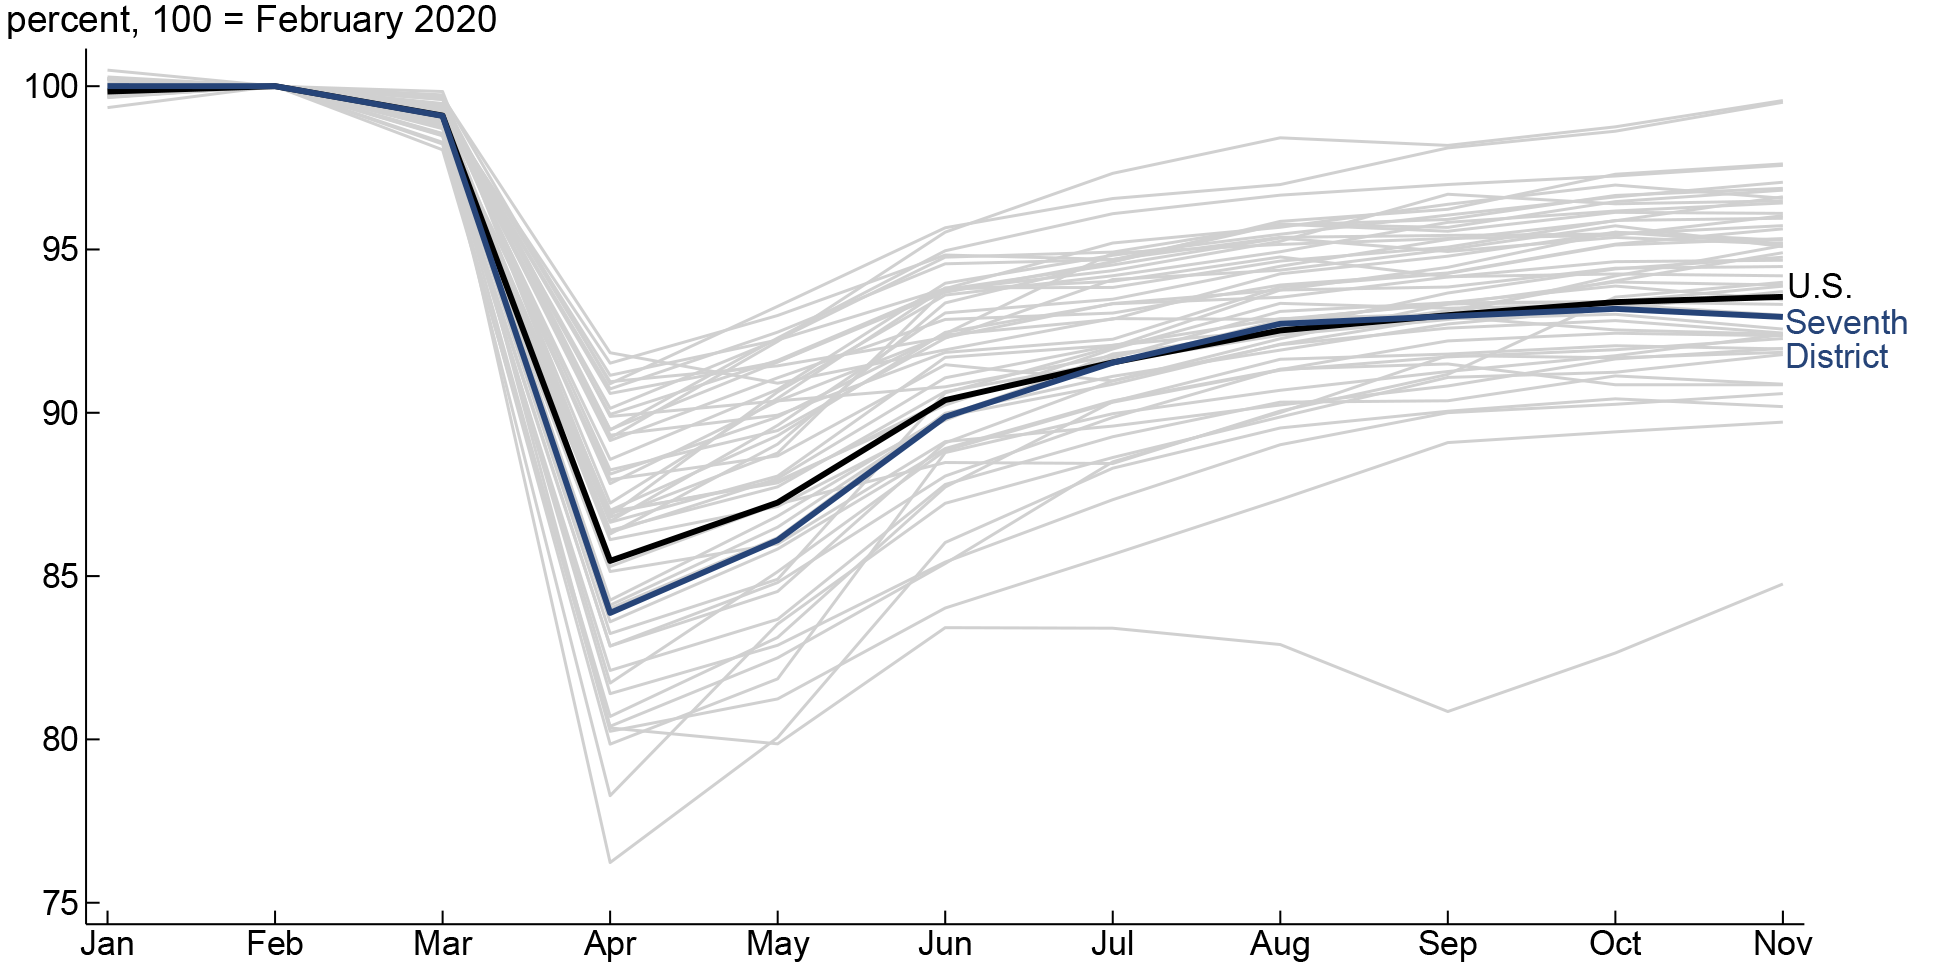
Source: Author’s calculations based on data from the U.S. Bureau of Labor Statistics from Haver Analytics.
Figure 2 summarizes the decline from February through April 2020 and the recovery from April through November for the U.S. as a whole and each state (as well as the District of Columbia). The dark blue dashed line shows the percentage change in employment for the U.S. from February through April, and the black dashed line shows the change from February through November. States are ordered from left to right by the size of the percentage decline between February and April—which is represented by the blue bars. The black diamonds show where employment was in November relative to February. So the distance between the bottom of a blue bar and its corresponding black diamond is the share of February employment that a state regained from April to November. As of November, employment levels in Idaho and Utah—the two states with the fastest employment growth during 2015–19—were almost back to where they respectively stood in February. At the other extreme, employment in Hawaii—whose economy is quite dependent on tourism—was by far the farthest from its February level. Every state had a unique employment experience; but unlike these three outliers, most of the states had experiences closer to that of the nation. By November, the U.S. had regained 56% of its lost jobs and 35 states had regained between 46% and 66% percent of their lost jobs.
According to figure 2, states in the Seventh District (denoted in red) had a wide range of employment changes in 2020. Michigan had the largest employment decline of any state in the nation: It lost almost 24% of its workers between February and April. Michigan also regained the largest share of its pre-pandemic workforce through November (14%), though employment was still about 10% lower than it was in February. In percentage terms, Wisconsin’s employment decline was a little worse than the nation’s and its recovery was about the same, so its employment situation in November was a little worse than the nation’s. Indiana’s employment decline was a little smaller than that of the U.S., but by November it had regained nearly 10% of its workforce and was the closer to its February level than any other Seventh District state. Illinois’s employment decline was smaller than the nation’s, but its recovery was comparatively slower, so its position in November was close to that of the U.S. Iowa had the smallest employment decline of any state in the District and its recovery was just a bit slower than the nation’s, so it was in a better place in terms of employment than the U.S. in November. Clearly, the pandemic recession has adversely affected all five Seventh District states, but the employment effect has also varied quite a bit.
2. Change in nonfarm payroll employment of each U.S. state from February through November 2020
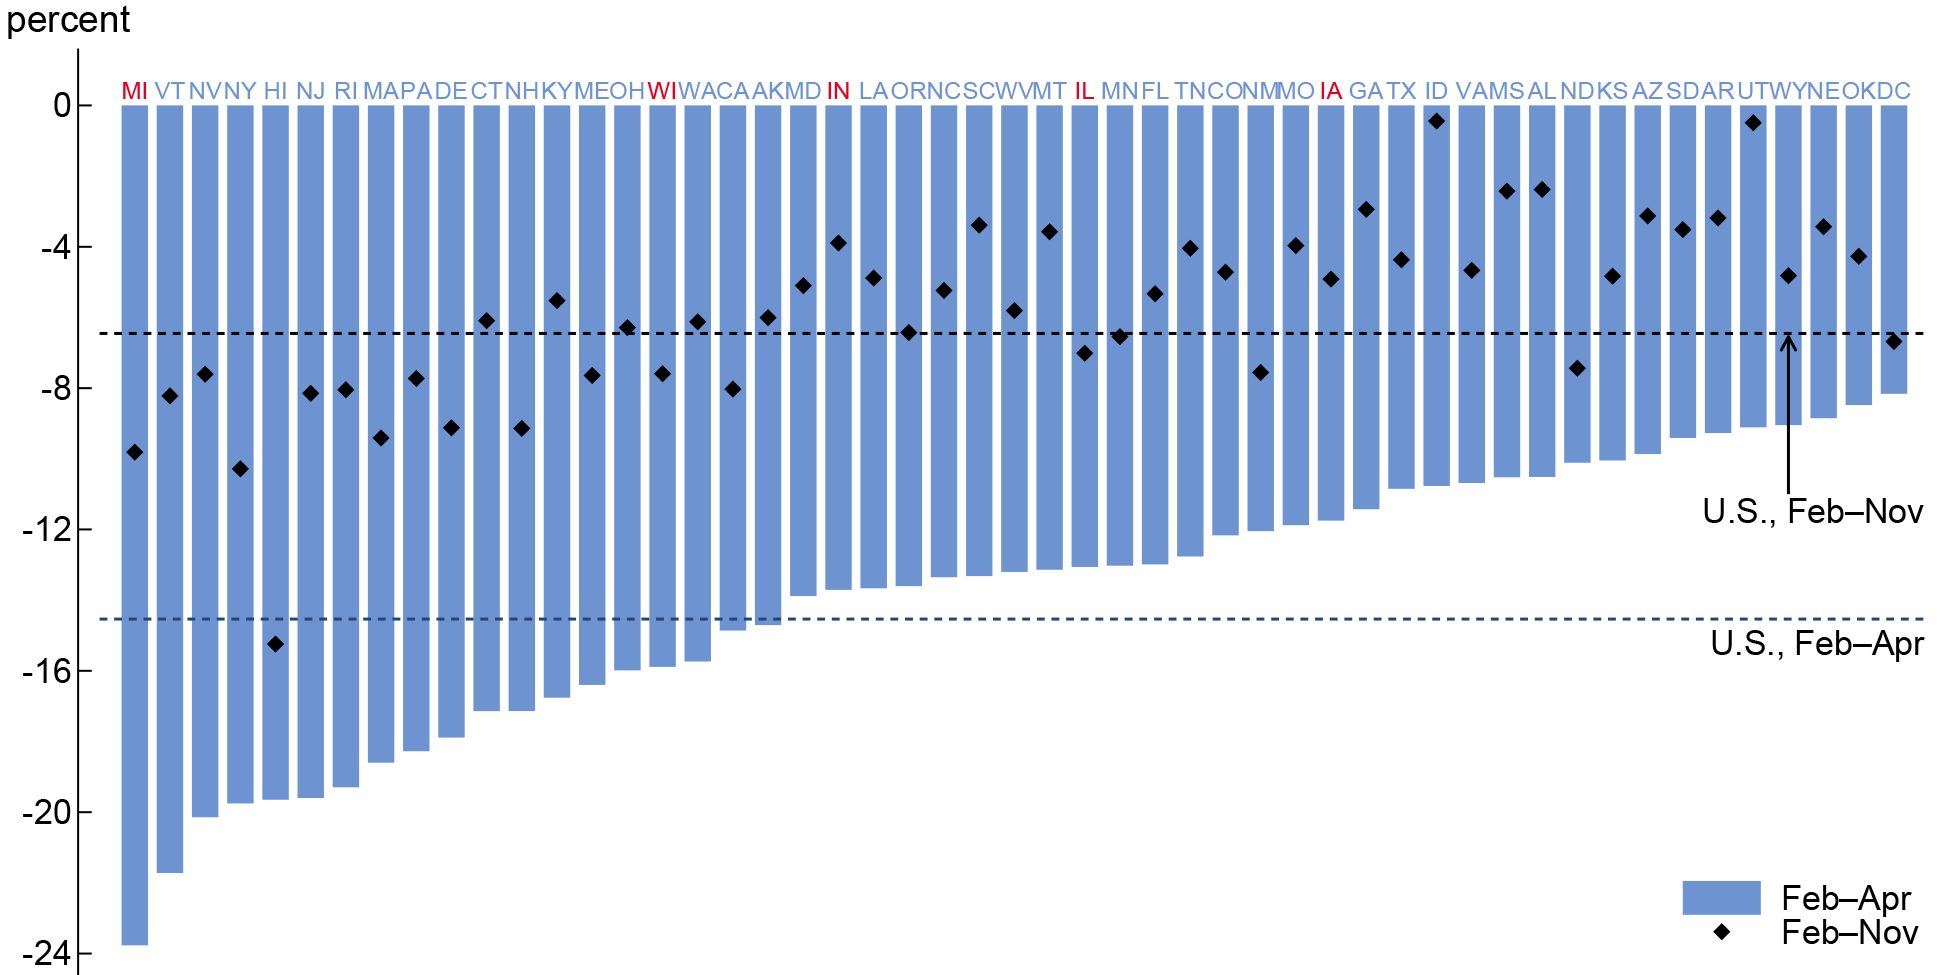
Source: Author’s calculations based on data from the U.S. Bureau of Labor Statistics from Haver Analytics.
What can explain the different economic experiences states have had during the pandemic? In a subsequent post, I will explore a number of potential explanations, including outbreak size, stay-at-home order strictness, industry mix, political orientation, and pre-pandemic employment growth rate. While it is important to understand why states have had different experiences, in the end, we know that it is the virus that started the employment downturn in every state; and I do not expect a return to pre-pandemic employment levels in every state until the virus is under control. At the beginning of 2021, we have a ways to go, but we also have hope that we’ll be in a much better place by the beginning of 2022.
Notes
1 The Seventh District covers all of Iowa and most of Illinois, Indiana, Michigan, and Wisconsin. However, in this post, data for the Seventh District are for the entirety of Illinois, Indiana, Iowa, Michigan, and Wisconsin.


