Are Slow-Growth States Growing Slower Again?
To measure economic activity, we use nonfarm payroll employment. While this measure is less comprehensive than gross state product, it is released on a monthly rather than quarterly basis and goes through December 2021 instead of 2021:Q3. To assess whether structural factors are playing a role in the size of states’ recoveries, we compare long-run employment growth (measured as the percent change in employment from January 2015 to January 2020) with pandemic-era employment growth (measured as the percent change in employment from January 2020 to December 2021).3 If long-run pre-pandemic growth predicts growth since the pandemic began, it is a sign that structural factors are at play.
Figure 1 shows the association between pre-pandemic and pandemic-era employment growth across U.S. states. There is a clear positive relationship, where states that grew slower prior to the pandemic tend to have recovered more slowly from the Covid-19 pandemic recession. (The recession technically lasted only two months, though its effects have lingered much longer.) For example, the five states that lost employment prior to the pandemic—namely, Alaska, Louisiana, North Dakota, West Virginia, and Wyoming—have all experienced slower employment growth than the median state since the start of the pandemic. In contrast, employment in Utah and Idaho increased more than 16% from January 2015 to January 2020, and they are also two of four states whose levels of employment are now higher than before the pandemic (that is, the states above zero on the vertical axis of figure 1).
Focusing on the states within the Seventh Federal Reserve District (that is, Illinois, Indiana, Iowa, Michigan, and Wisconsin), we see that they’re clustered somewhat below the median pre-pandemic employment growth rate for the 50 states. Taking into account District states’ pre-pandemic employment growth rates, Illinois’s and Michigan’s recoveries have been relatively weak, Wisconsin’s has been as predicted, and Indiana’s and Iowa’s have been relatively strong. Overall, the Seventh District’s employment growth was slower than the nation’s prior to the pandemic (4.4% versus 8.2%); and the District’s jobs growth has been slower since the pandemic began (–4.2% versus –2.5%), in line with the association shown in figure 1.
1. Association between pre-pandemic and pandemic-era employment growth across states
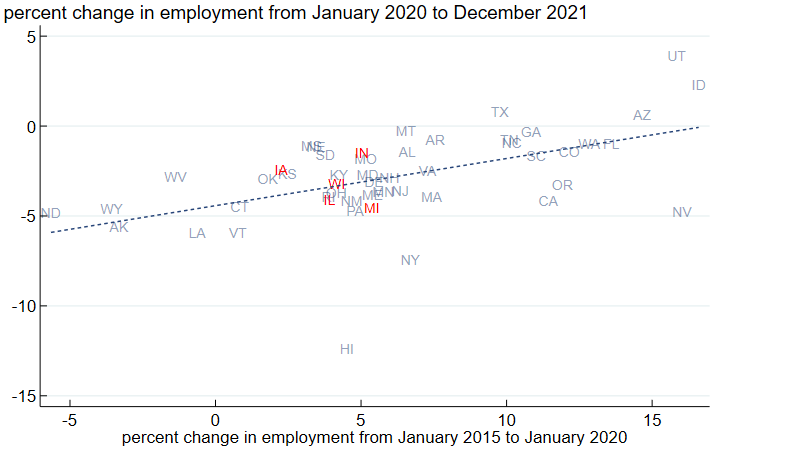
Source: Authors’ calculations based on data from the U.S. Bureau of Labor Statistics from Haver Analytics.
To see how the recovery from the pandemic recession has played out from month to month, we group states into quartiles of long-run employment growth4 and, for each month, take an average of their employment change relative to January 2020. We put the group of states with the highest employment growth from January 2015 to January 2020 in the first quartile and the states with the lowest employment growth in the fourth quartile.
At the beginning of the pandemic, third quartile states were hit the hardest, while first and fourth quartile states were hit relatively less hard. Starting in May 2020, employment relative to January 2020 has consistently been highest for the first quartile. The fourth quartile experienced the smallest drop of any quartile from January to April 2020, but since then has steadily lost ground to the other quartiles: The second quartile surpassed it at the beginning of 2021; and as of December 2021, the third quartile nearly caught up to it. Thus, while the size of the cyclical employment shock created by the pandemic was not closely related to pre-pandemic payroll growth, the recovery from the shock clearly has been.
2. Change in pandemic-era employment, by quartile of long-run employment growth
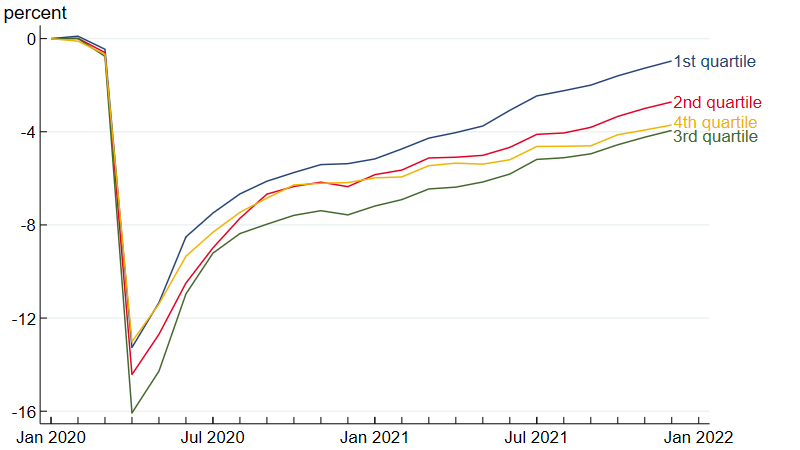
Source: Authors’ calculations based on data from the U.S. Bureau of Labor Statistics from Haver Analytics.
The pandemic is not over, and its impact on the economy isn’t either. Still, we are far enough into the economic recovery that long-run, structural factors are again starting to show up in the data. States in the Seventh District were relatively slow growing in terms of employment prior to the pandemic; and structural factors, such as an industry mix with a high proportion in manufacturing (see this blog post for more analysis), are again opening up a gap between the District’s employment growth and the nation’s.
Notes
1 Potential structural changes resulting from the pandemic include increased remote work, early retirements, and a higher rate of job quits.
2 While the World Health Organization (WHO) did not officially declare Covid-19 a pandemic until March 11, 2020, it declared the virus a global health emergency of international concern on January 31, 2020, and the U.S. Secretary of Health and Human Services declared it a public health emergency on the same day; see the Centers for Disease Control and Prevention’s Covid-19 timeline.
3 We also measured long-run employment growth as the change in employment from January 2010 to January 2020 and from January 2012 to January 2020. Using these periods with different starting points resulted in a similar, but slightly smaller, correlation between long-run growth and pandemic-era growth.
4 The states by quartile are as follows: quartile 1) Arizona, California, Colorado, Florida, Georgia, Idaho, Nevada, North Carolina, Oregon, South Carolina, Tennessee, Utah, and Washington; quartile 2) Alabama, Arkansas, Delaware, Maine, Massachusetts, Minnesota, Montana, New Hampshire, New Jersey, New York, Texas, and Virginia; quartile 3) Hawaii, Illinois, Indiana, Kentucky, Maryland, Michigan, Missouri, New Mexico, Ohio, Pennsylvania, Rhode Island, South Dakota, and Wisconsin; and quartile 4) Alaska, Connecticut, Iowa, Kansas, Louisiana, Mississippi, Nebraska, North Dakota, Oklahoma, Vermont, West Virginia, and Wyoming.


