• Print
  • Email

Chicago Fed Insights, July 2024
What’s New in CARTS 2.1? Updates to Our Index Tracking National Retail Sales

In this Chicago Fed Insights article, we provide an update on the Chicago Fed Advance Retail Trade Summary (CARTS). As readers may remember, CARTS debuted in mid-2021. A summary measure of multiple high-frequency indicators of retail sales (including payment card transactions, foot traffic, gas sales, and consumer sentiment), CARTS grew out of pandemic-era research that aimed to improve the timeliness and reliability of traditional measures of U.S. retail spending.

To achieve these goals, CARTS introduced new weekly indexes benchmarked to the U.S. Census Bureau’s monthly measure of retail & food services sales excluding motor vehicles & parts (ex. auto) and the U.S. Bureau of Economic Analysis’s (BEA) monthly measure of retail prices for the same category of spending, allowing for a direct comparison with the latest readings of each of these closely followed data releases and projections for nominal and inflation-adjusted sales.

CARTS 1.0 came to an end in early 2022, when production was suspended after the loss of data from several data providers. CARTS 2.0 was then unveiled in January 2024 in a previous article and paused in mid-May 2024 after a further loss of data. Here, we summarize the ongoing improvements to several of the underlying data sources and the seasonal adjustment process used in our new and improved CARTS 2.1.

New and improved data sources

In May 2024, the BEA stopped publishing its high-frequency payment card transaction data that had been an input to CARTS 2.0. To compensate for the loss of this data series, CARTS 2.1 both improves upon several of the measures that were previously used in CARTS 2.0 and incorporates new alternative consumer spending indicators.

The revisions made to the series used in both CARTS 2.0 and CARTS 2.1 were largely granular in nature and involved an improved parsing of retail transactions or visit records to be more in line with the goal of CARTS being a real-time measure of retail & food services sales ex. auto (e.g., this includes changes made to the Facteus card data, the Numerator customer receipt data, and the Advan Research retail foot traffic data).

New in CARTS 2.1 is a daily measure of consumer spending from Bloomberg Second Measure. In addition to this new data source and the changes made to existing data sources, CARTS 2.1 continues to use the high-frequency payment card data from Consumer Edge and SafeGraph, along with weekly measures of consumer sentiment from Morning Consult and gasoline sales from the U.S. Energy Information Administration (EIA).

Robust seasonal adjustment

The eight weekly times series1 included in CARTS 2.1 are each seasonally adjusted. Seasonal adjustment of high-frequency economic time series is challenging. Most widely followed economic statistics are measured monthly or quarterly and use the Census Bureau’s well-documented X-13ARIMA-SEATS methodology to seasonally adjust the data. There is less consensus on the best practices for the seasonal adjustment of weekly time series—particularly retail sales, which exhibit highly seasonal fluctuations around holidays (some of which fall on a different week of a month from year to year).

Our seasonal adjustment procedure incorporates the Census Bureau’s monthly seasonal factors and also allows for seasonal variation at the weekly frequency driven by retail holidays in the U.S. and other estimated seasonal factors particular to each data source. In CARTS 2.1, we add controls to this process to adjust for extreme weather fluctuations and variations in the timing of tax refunds that can sometimes be confused with seasonal factors at the weekly frequency.2

From many series to a single benchmarked index

The key feature of CARTS is its ability to combine these eight weekly time series with the Census Bureau’s monthly data on retail & food services sales ex. auto in a time-consistent fashion. The result is a Weekly Index of Retail Trade that is designed to match, when aggregated to a monthly frequency, the available Census Bureau data and to provide an initial estimate of these data ahead of each month’s new release from the Census Bureau.

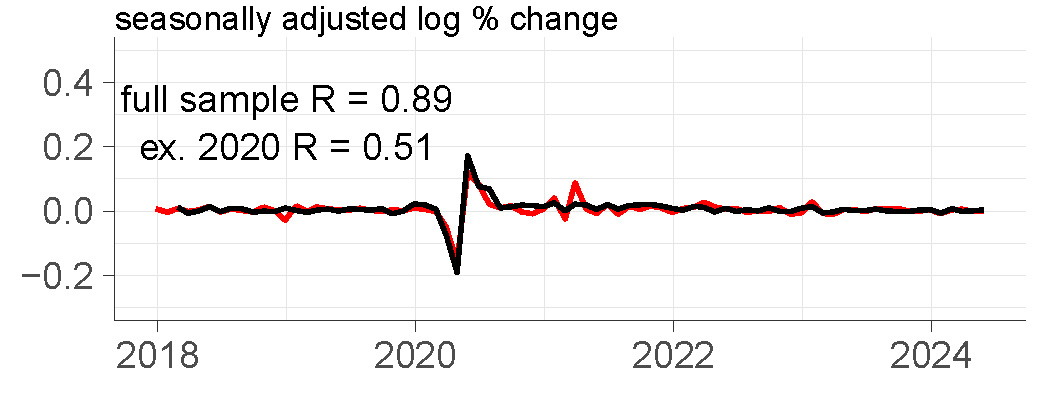
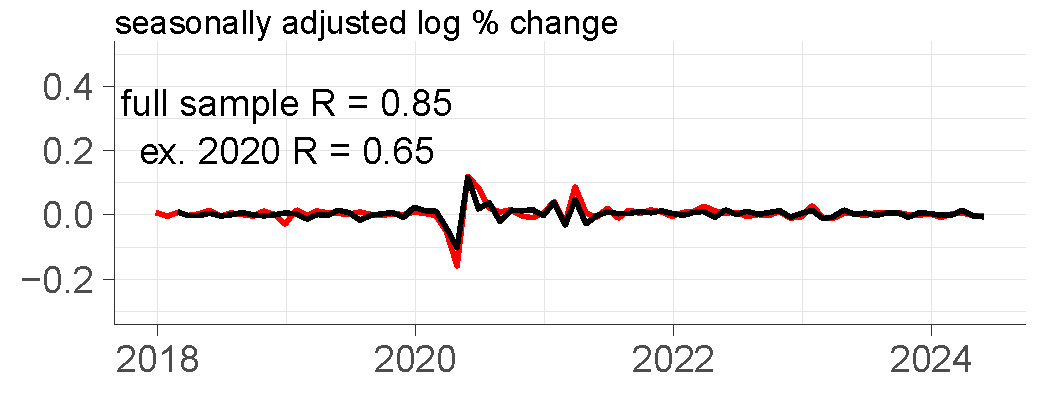
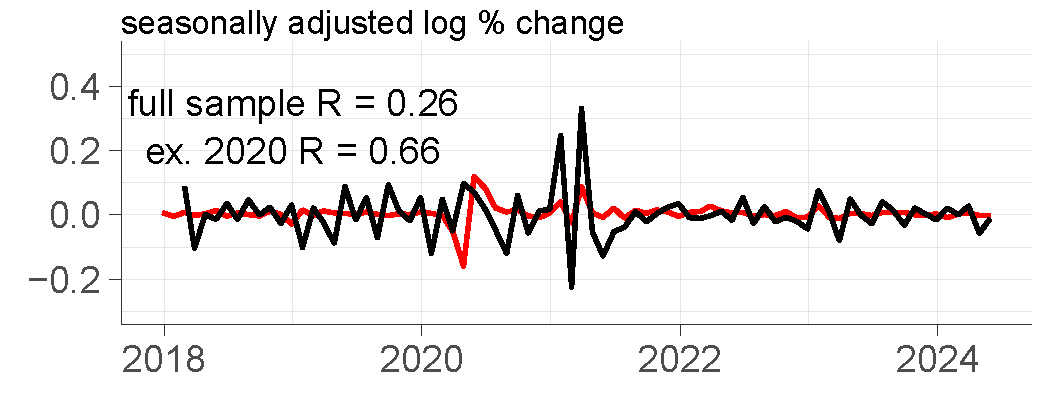
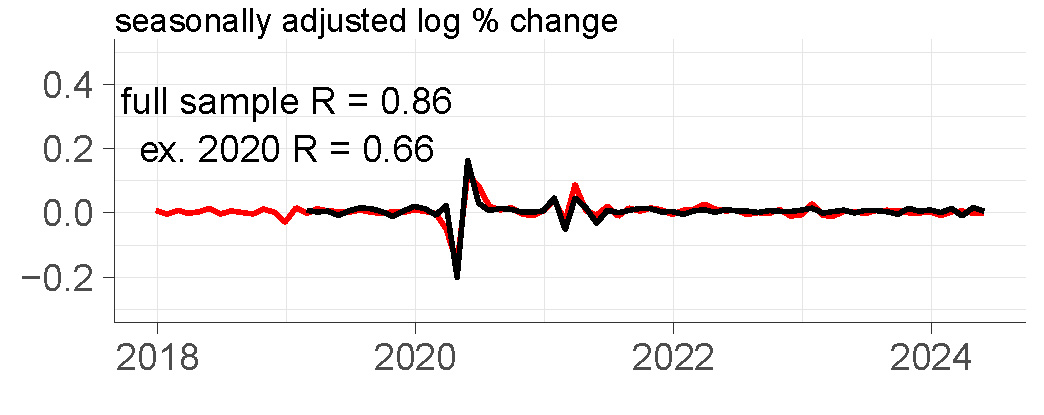
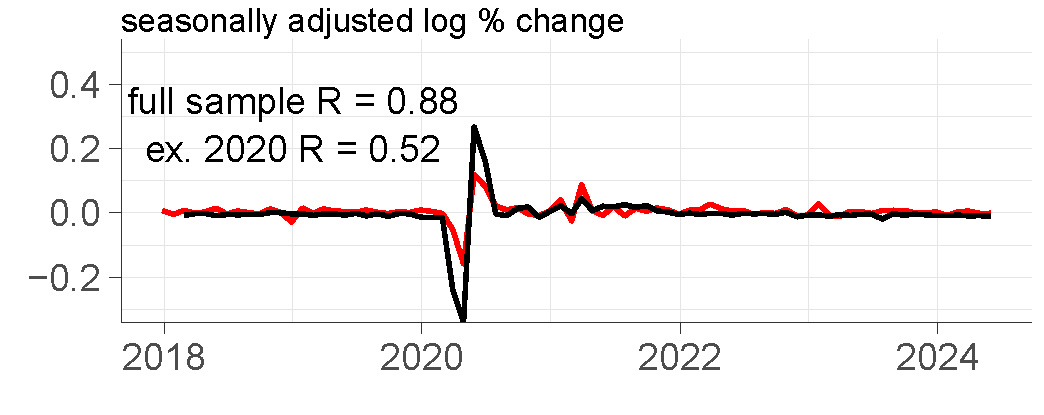
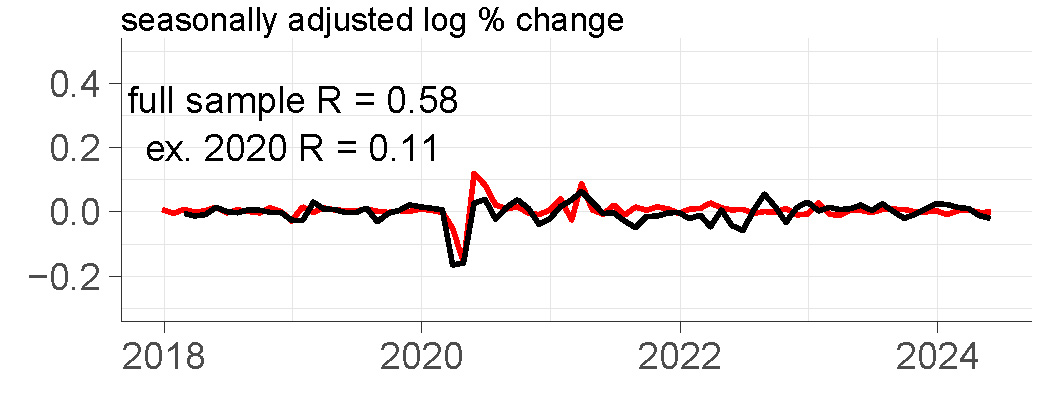
Figure 1 compares the month-over-month (log) percent change in each of the eight seasonally adjusted weekly time series used as inputs to CARTS (specifically, its Weekly Index of Retail Trade). The top left corner of each panel in this figure shows the correlation coefficient (R) between each of these data series used as inputs to CARTS and the Census Bureau’s monthly data series on retail & food services sales ex. auto. By construction, this correlation coefficient is 1 for the Weekly Index of Retail Trade given that it is benchmarked to the Census Bureau data. But for the index’s underlying inputs, the correlation coefficient ranges between 0.26 and 0.89.

A. Consumer Edge vs. Census data

Figure 1 has eight panels. Each panel features two lines: a black line for a different input to the Weekly Index of Retail Trade of the Chicago Fed Advance Retail Trade Summary (CARTS) and a red line for the U.S. Census Bureau's monthly data series on retail & food services sales excluding motor vehicles and parts. Each panel shows the two series in seasonally adjusted log percent changes from 2018 through mid-2024, and two summary statistics for the correlation between the two series: 1) the full sample R and 2) the ex. 2020 R, which excludes data of the months of 2020 from the calculation of the correlation coefficient. Higher R values indicate more similarity exhibited by the growth rates of the two series. Panel A shows Consumer Edge data with full sample R equal to 0.89 and ex. 2020 R equal 0.51.

B. Bloomberg Second Measure vs. Census data
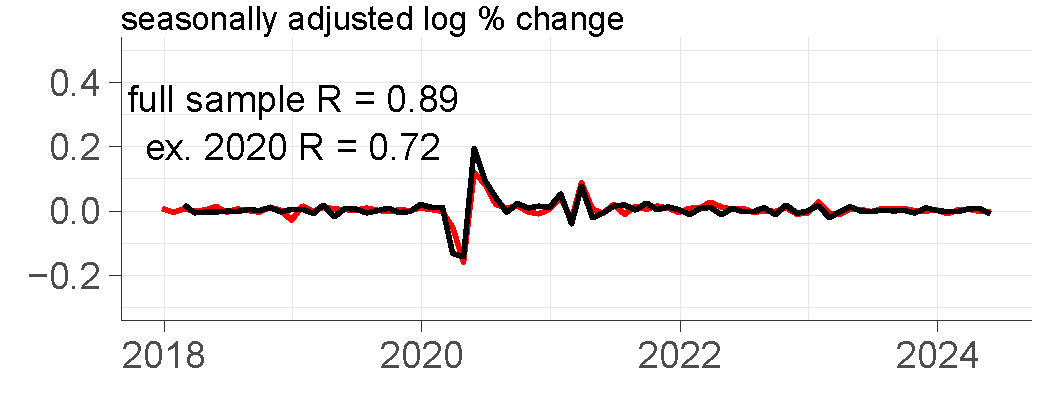
Figure 1 has eight panels. Each panel features two lines: a black line for a different input to the Weekly Index of Retail Trade of the Chicago Fed Advance Retail Trade Summary (CARTS) and a red line for the U.S. Census Bureau's monthly data series on retail & food services sales excluding motor vehicles and parts. Each panel shows the two series in seasonally adjusted log percent changes from 2018 through mid-2024, and two summary statistics for the correlation between the two series: 1) the full sample R and 2) the ex. 2020 R, which excludes data of the months of 2020 from the calculation of the correlation coefficient. Higher R values indicate more similarity exhibited by the growth rates of the two series. Panel B shows Bloomberg Second Measure data with full sample R equal to 0.89 and ex. 2020 R equal to 0.72.

C. Numerator vs. Census data

Figure 1 has eight panels. Each panel features two lines: a black line for a different input to the Weekly Index of Retail Trade of the Chicago Fed Advance Retail Trade Summary (CARTS) and a red line for the U.S. Census Bureau's monthly data series on retail & food services sales excluding motor vehicles and parts. Each panel shows the two series in seasonally adjusted log percent changes from 2018 through mid-2024, and two summary statistics for the correlation between the two series: 1) the full sample R and 2) the ex. 2020 R, which excludes data of the months of 2020 from the calculation of the correlation coefficient. Higher R values indicate more similarity exhibited by the growth rates of the two series. Panel C shows Numerator data with full sample R equal to 0.85 and ex. 2020 R equal to 0.65.

D. Facteus vs. Census data

Figure 1 has eight panels. Each panel features two lines: a black line for a different input to the Weekly Index of Retail Trade of the Chicago Fed Advance Retail Trade Summary (CARTS) and a red line for the U.S. Census Bureau's monthly data series on retail & food services sales excluding motor vehicles and parts. Each panel shows the two series in seasonally adjusted log percent changes from 2018 through mid-2024, and two summary statistics for the correlation between the two series: 1) the full sample R and 2) the ex. 2020 R, which excludes data of the months of 2020 from the calculation of the correlation coefficient. Higher R values indicate more similarity exhibited by the growth rates of the two series. Panel D shows Facteus data with full sample R equal to 0.26 and ex. 2020 R equal to 0.66.

E. SafeGraph vs. Census data

Figure 1 has eight panels. Each panel features two lines: a black line for a different input to the Weekly Index of Retail Trade of the Chicago Fed Advance Retail Trade Summary (CARTS) and a red line for the U.S. Census Bureau's monthly data series on retail & food services sales excluding motor vehicles and parts. Each panel shows the two series in seasonally adjusted log percent changes from 2018 through mid-2024, and two summary statistics for the correlation between the two series: 1) the full sample R and 2) the ex. 2020 R, which excludes data of the months of 2020 from the calculation of the correlation coefficient. Higher R values indicate more similarity exhibited by the growth rates of the two series. Panel E shows SafeGraph data with full sample R equal to 0.86 and ex. 2020 R equal to 0.66.

F. Advan Research vs. Census data

Figure 1 has eight panels. Each panel features two lines: a black line for a different input to the Weekly Index of Retail Trade of the Chicago Fed Advance Retail Trade Summary (CARTS) and a red line for the U.S. Census Bureau's monthly data series on retail & food services sales excluding motor vehicles and parts. Each panel shows the two series in seasonally adjusted log percent changes from 2018 through mid-2024, and two summary statistics for the correlation between the two series: 1) the full sample R and 2) the ex. 2020 R, which excludes data of the months of 2020 from the calculation of the correlation coefficient. Higher R values indicate more similarity exhibited by the growth rates of the two series. Panel F shows Advan Research data with full sample R equal to 0.88 and ex. 2020 R equal 0.52.

G. EIA vs. Census data

Figure 1 has eight panels. Each panel features two lines: a black line for a different input to the Weekly Index of Retail Trade of the Chicago Fed Advance Retail Trade Summary (CARTS) and a red line for the U.S. Census Bureau's monthly data series on retail & food services sales excluding motor vehicles and parts. Each panel shows the two series in seasonally adjusted log percent changes from 2018 through mid-2024, and two summary statistics for the correlation between the two series: 1) the full sample R and 2) the ex. 2020 R, which excludes data of the months of 2020 from the calculation of the correlation coefficient. Higher R values indicate more similarity exhibited by the growth rates of the two series. Panel G shows EIA data with full sample R equal to 0.87 and ex. 2020 R equal to 0.46.

H. Morning Consult vs. Census data

Figure 1 has eight panels. Each panel features two lines: a black line for a different input to the Weekly Index of Retail Trade of the Chicago Fed Advance Retail Trade Summary (CARTS) and a red line for the U.S. Census Bureau's monthly data series on retail & food services sales excluding motor vehicles and parts. Each panel shows the two series in seasonally adjusted log percent changes from 2018 through mid-2024, and two summary statistics for the correlation between the two series: 1) the full sample R and 2) the ex. 2020 R, which excludes data of the months of 2020 from the calculation of the correlation coefficient. Higher R values indicate more similarity exhibited by the growth rates of the two series. Panel H shows Morning Consult data with full sample R equal to 0.58 and ex. 2020 R equal to 0.11.
Notes: CARTS stands for Chicago Fed Advance Retail Trade Summary. EIA stands for U.S. Energy Information Administration. R is the correlation coefficient between each of the eight data series (the black lines in each panel) that are used as inputs to CARTS—specifically, its Weekly Index of Retail Trade—and the U.S. Census Bureau’s monthly data series on retail & food services sales ex. auto (the same red line in each panel); see the text for further details on these data, including their seasonal adjustment.
Sources: Authors’ calculations based on data from Haver Analytics, Consumer Edge, Bloomberg Second Measure, Numerator, Facteus, SafeGraph, Advan Research, and Morning Consult.

Because the values of R are naturally bounded above by 1, correlation coefficients of this magnitude indicate a moderate to high degree of positive correlation for each CARTS input series with the Census Bureau’s retail sales data. To ensure that this is not a feature solely of the atypical Covid-19 pandemic period and the restrictions on mobility that accompanied its early stages, we recompute the values of R in the figure excluding data from the months of 2020. In this case, the correlation coefficients range between 0.11 and 0.72, slightly lower than those over the full sample period but still quite high in many cases.

The Census Bureau data are not adjusted for changes over time in the prices of retail goods and services. However, CARTS also contains a weekly estimate of the price deflator used by the BEA to convert retail sales into an inflation-adjusted measure. This Weekly Index of Retail Prices is constructed such that when aggregated to the monthly frequency it matches the BEA’s monthly chain-weighted price index for retail & food services sales ex. auto whenever it is observed. Continuing to inform this index in CARTS 2.1 are measures of online prices from State Street PriceStats (weekly) and Adobe (monthly) and weekly gas prices from the EIA.

Latest results

As of July 15, 2024, the Chicago Fed Advance Retail Trade Summary has resumed, releasing its results on previously scheduled days: 1) a day ahead of the U.S. Census Bureau’s retail sales release summarizing data through the end of the prior month (final release) and 2) near the end of each month summarizing the weekly data available through mid-month (preliminary release). We summarize below the CARTS 2.1 final results for June 2024.
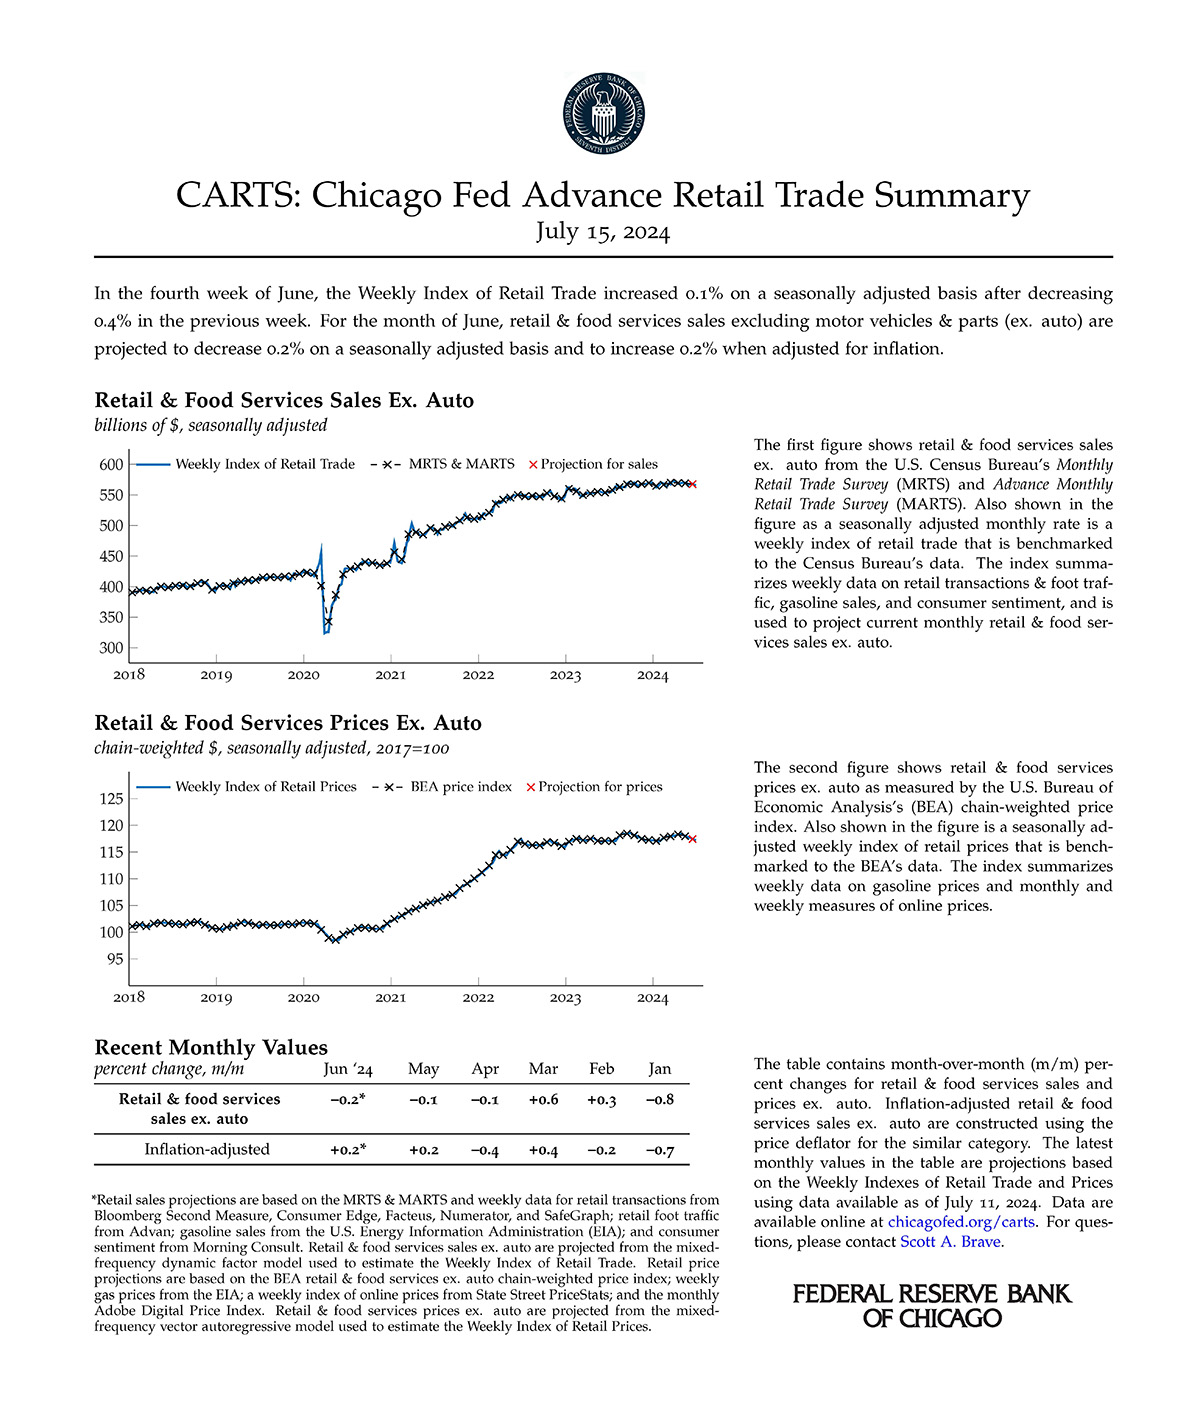
This is an image of the CARTS release with the final June 2024 results.

Notes

1 We use a regularized weekly calendar that runs from days 1–7, 8–14, 15–21, and 22 to the end of each month. The varying number of days in the fourth week of each month is then corrected for during seasonal adjustment.

2 All of this takes place jointly using the Prophet package developed by Facebook’s data scientists.

Subscribe Now

Register to receive email alerts when new issues are published.

Subscribe

Having trouble accessing something on this page? Please send us an email and we will get back to you as quickly as we can.

Federal Reserve Bank of Chicago, 230 South LaSalle Street, Chicago, Illinois 60604-1413, USA. Tel. (312) 322-5322

Copyright © 2024. All rights reserved.

Please review our Privacy Policy | Legal Notices