Seventh District Year in Review for 2022: Economic Growth Slows, Moving Closer to Long-Run Trend
The Seventh Federal Reserve District1 and the entire nation both experienced slower growth in 2022 than in 2021, which was a year of very strong growth following the very deep pandemic recession. Growth in both the Seventh District and the country as a whole was closer to their respective long-run trends. A tight labor market and supply chain issues were two of the big economic stories of 2022; while both factors are having impacts on the District’s economy now, there are signs that job markets and supply chains are returning to their historical norms. With the economic effects of the pandemic waning, it’s becoming clearer that the Seventh District remains on a relatively slow-growth trajectory. In this blog post, we explore these changes and trends, as well as their implications for the regional and national economies in 2023.
National and Seventh District growth slowed in 2022
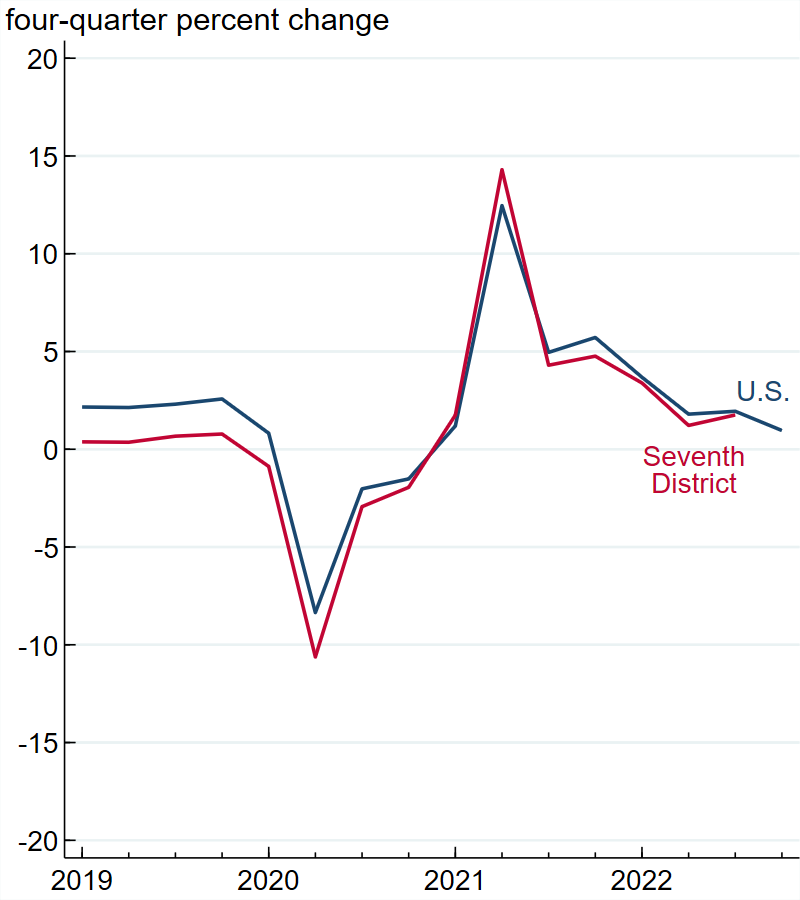
The slowdown in economic activity in the U.S. and Seventh District is apparent when it’s measured in terms of both real gross domestic product (GDP) and nonfarm payroll employment—see panels A and B of figure 1. Panel A tracks the year-over-year percent change in GDP (on a quarterly basis) for the nation (as the blue line) and for the Seventh District (as the red line). State-level GDP data for the fourth quarter of 2022 will not be released until later this year, but it is clear that year-over-year GDP growth for the Seventh District states and the nation was trending downward in 2022. (Note that quarter-over-quarter real GDP growth for the U.S. was higher in the second half of 2022 than in the first half.) In the third quarter of 2022, the Seventh District’s GDP growth rate edged up to almost meet the nation’s, though we have yet to see what the District’s growth rate will be for the final quarter of 2022. The tight link between the paths of U.S. and Seventh District annual GDP growth suggests the District’s fourth quarter number will be lower than its third quarter number. For the most part, there has been a small but consistent gap between the Seventh District’s and the nation’s GDP growth rates since about the middle of 2021. This may indicate a return to the long-run pattern of the District’s growth lagging the nation’s.
1. Year-over-year real gross domestic product (GDP) and nonfarm payroll employment growth in the U.S. and Seventh District
A. Real GDP
B. Employment
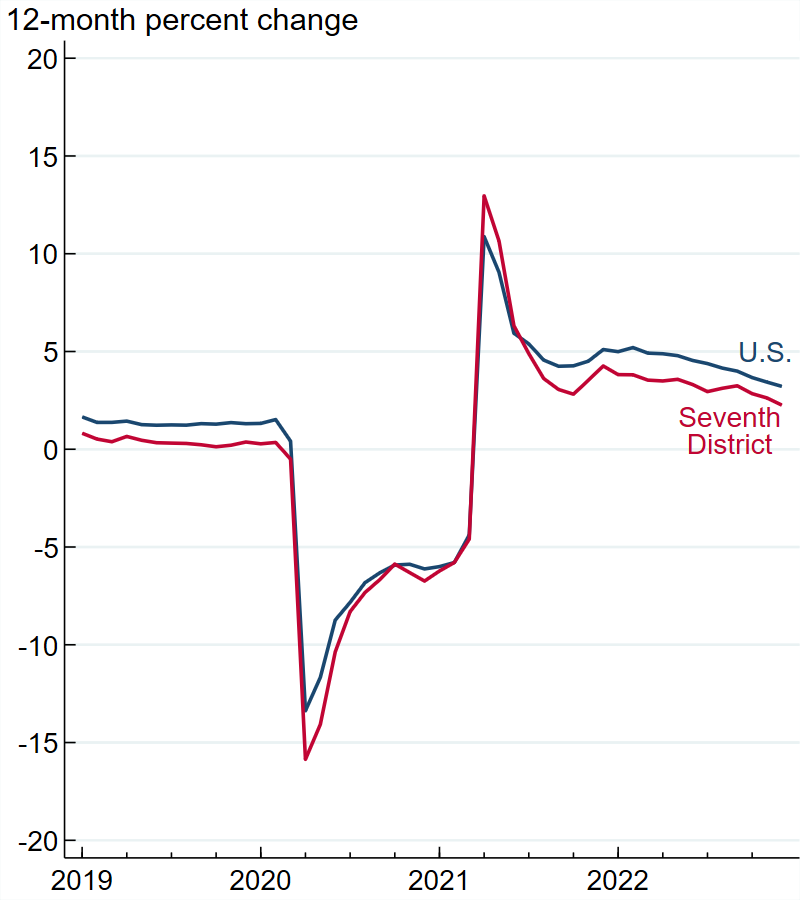
Sources: Authors’ calculations based on data from the U.S. Bureau of Economic Analysis and U.S. Bureau of Labor Statistics from Haver Analytics.
Panel B shows that nonfarm payroll employment growth rates for the U.S. and the Seventh District states were also on a downward trajectory in 2022. An advantage of the employment data is that they are already available for both the nation and District states through December 2022; and the data for the fourth quarter of 2022 (i.e., October, November, and December) show that even though employment nudged up a bit during the third quarter (i.e., July, August, and September), it continued its downward trend for the rest of the year. However, employment growth did not decline as much as real GDP growth did during 2022. While growth rates for both measures may be declining, they remain positive and are now closer to the rates typical of pre-pandemic years; these results suggest that the economy has largely moved on from the effects of the pandemic.
Notably, as with their real GDP growth rates, the District’s employment growth rate has been lagging the nation’s since around mid-2021—a development we explore later in this post. This gap is in line with the historical pattern for District employment growth relative to U.S. employment growth.
Slower growth has eased labor and nonlabor cost pressures
Two major economic stories of 2022 were the tight labor market and supply chain issues, which contributed to high inflation (6.5% from December 2021 to December 2022, according to the Consumer Price Index from the U.S. Bureau of Labor Statistics). While there are signs that the labor market is still quite tight—including very low unemployment rates in the nation (3.5% in December and 3.4% in January) and the Seventh District (3.7% in December)—2022 included some signs of loosening. Figure 2 shows that according to Chicago Fed Survey of Economic Conditions (CFSEC) respondents, labor cost pressures eased substantially in the second half of 2022 and are now growing at around trend (the red line is near zero). There are also signs that supply chain troubles are subsiding: CFSEC respondents are reporting that nonlabor costs are now growing at around trend (the blue line is near zero in figure 2). The decline in nonlabor input costs is in line with what the New York Fed’s Global Supply Chain Pressure Index is indicating.
2. Chicago Fed Survey of Economic Conditions (CFSEC) labor and nonlabor cost pressures indexes
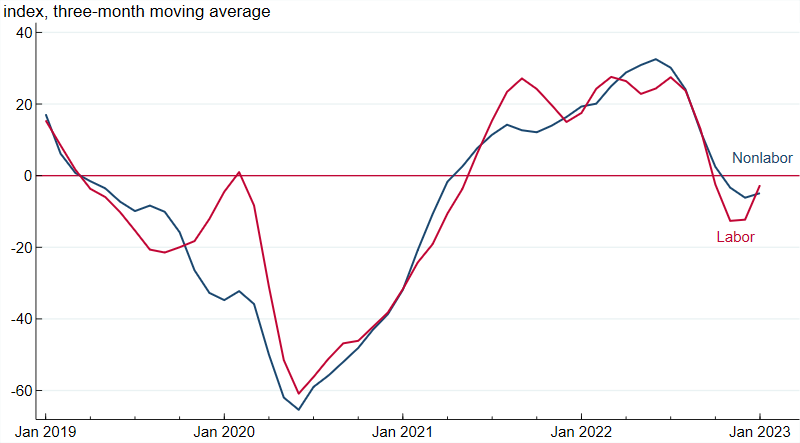
Source: Authors’ calculations based on data from the Chicago Fed Survey of Economic Conditions.
Once again, the Seventh District’s growth is lagging the nation’s
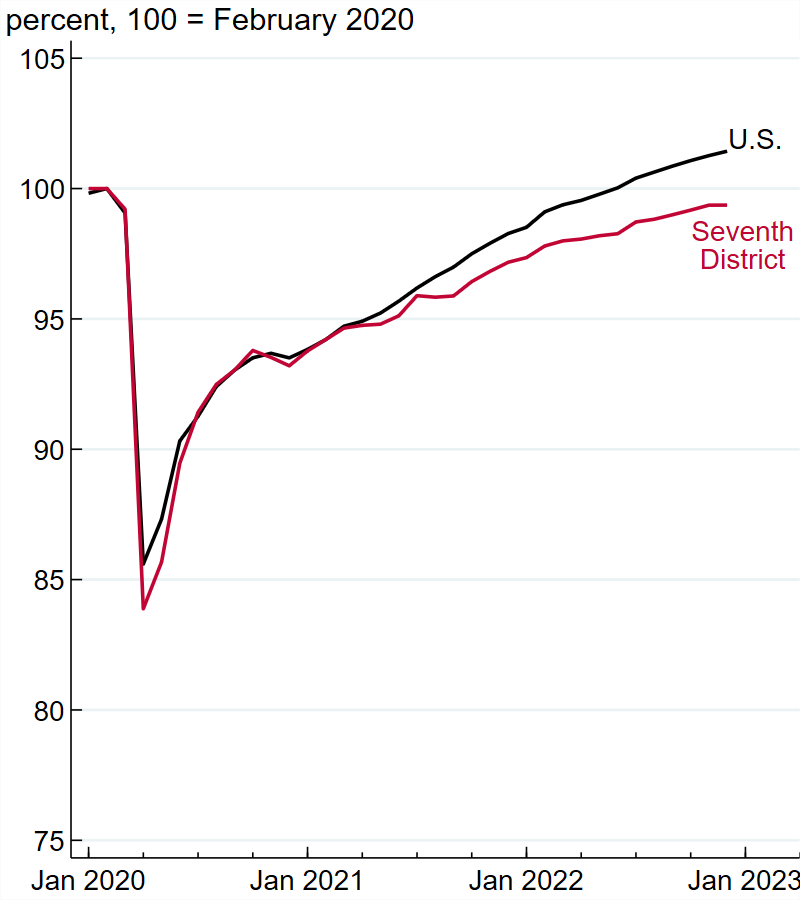
As discussed earlier and shown in figure 1, the Seventh District’s growth rates for real GDP and nonfarm payroll employment have been lagging those of the U.S. again since the middle of 2021. In this section, we explore how different employment growth rates have affected employment levels for the nation, the District, and District states, using February 2020 as our reference point because it is the month before the pandemic recession started.2 Figure 3 shows employment for these areas indexed to February 2020, where 100% indicates that employment is at its February 2020 level. For example, in panel A, we see that the nation’s employment (the black line) dropped down to almost 85% of its February 2020 level in April 2020 and the District’s (the red line) dropped even lower relative to its February 2020 level. The 2022 data show that the District’s employment recovery has been lagging further and further behind that of the U.S. As of December 2022, the District had not reached its February 2020 employment level, whereas the country as a whole surpassed its February 2020 employment level in June 2022. What can explain the District’s weaker recovery? An October 2022 Midwest Economy blog post explored two measures that strongly predict how quickly states have recovered from the pandemic recession: states’ pre-pandemic growth rates (measured as the change in employment over the five years leading up to the pandemic recession) and the size of states’ employment decline at the beginning of the pandemic in the U.S. (measured as the change in employment from February through April 2020). The stronger the pre-pandemic growth rate was, the faster the recovery. And the smaller the decline at the beginning of the pandemic was, the faster the recovery. Both of these documented relationships help explain the path of Seventh District employment relative to that of national employment shown in panel A of figure 3. Over the five years prior to the pandemic, employment growth for the District was 4.3% in total—much lower than the nation’s employment growth of 8.2%; moreover, the District lost a larger share of its employment than the nation as a whole did at the start of the pandemic. Because the Seventh District’s recovery caught up to that of the U.S. by the middle of 2020, the District’s history of relatively slower growth is more likely the explanation for the relatively weaker growth it saw in 2022.
3. Nonfarm payroll employment indexes for the U.S., Seventh District, and Seventh District States
A. U.S. and Seventh District
B. Seventh District states
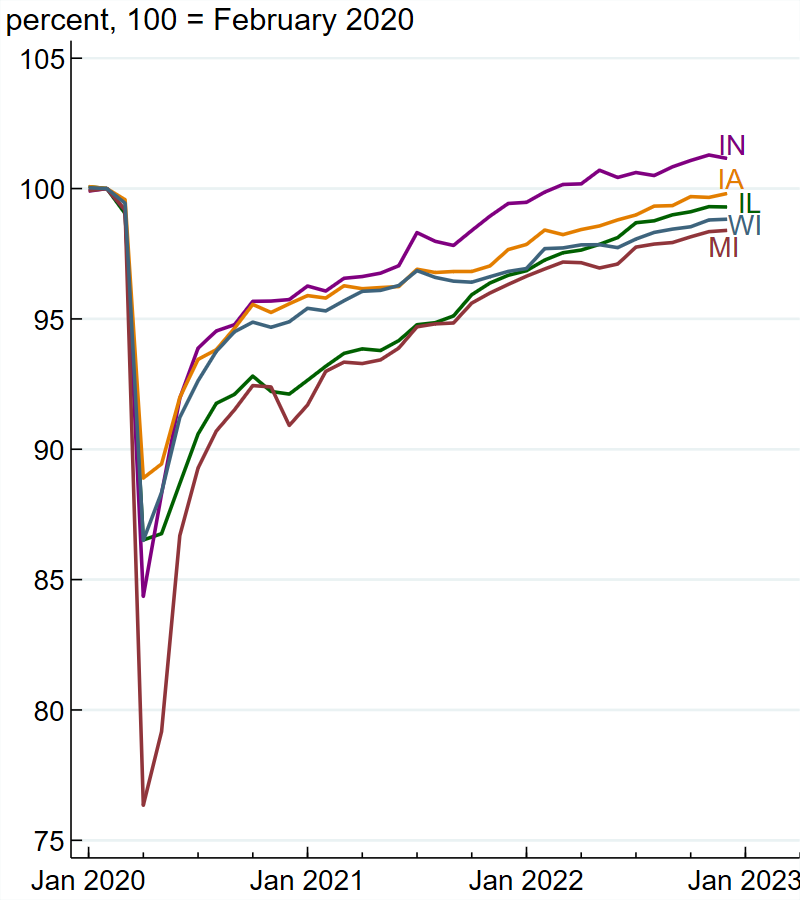
Source: Authors’ calculations based on data from the U.S. Bureau of Labor Statistics from Haver Analytics.
Panel B of figure 3 shows that the extent of the employment recovery across the Seventh District states varies a fair amount. Illinois, Michigan, and Wisconsin have had weaker recoveries than the other two states in the District. All three had slow pre-pandemic employment growth, so their slow-growth performance in 2022 represents a return to trend. Employment in Michigan and Indiana fell the most drastically in 2020 (Michigan to around 76% of its pre-pandemic level), likely because of the shutdown of many manufacturers, including auto assembly plants, in April and May of that year. The swift resumption of production, along with very strong demand for warehousing, manufactured products, and vehicles (including recreational vehicles, for which production is highly concentrated in northern Indiana), can help explain why Indiana had a relatively strong recovery despite its large initial decline when the pandemic began. For Iowa, its smaller employment decline in 2020 and its high farm incomes in 2021 and 2022 are reasons why employment there may have recovered faster than in Illinois, Michigan, and Wisconsin.
Conclusion
Economic growth in the U.S. and the Seventh District slowed in 2022 from 2021’s very strong pace, helping to ease supply chain pressures and cool the very hot labor market. The District’s economy may be headed for a 2023 that is much closer to the long-run, pre-pandemic norm, compared with where it was over the past three years. But many observers, including some Blue Chip forecasters3 and CFSEC respondents, expect a recession this year, partly because the Federal Reserve has raised interest rates to help slow high inflation. As the nation’s manufacturing hub, the District’s economy may be disproportionately affected by higher interest rates because they discourage purchases of capital investment goods. But at the start of 2023, there is some hope that any further slowdown in growth will be mild and brief.
Notes
1 The Seventh Federal Reserve District (which is served by the Chicago Fed) comprises all of Iowa and most of Illinois, Indiana, Michigan, and Wisconsin. In this blog post, we analyze the entirety of each state in the District.
2 In some previous blog posts using nonfarm payroll employment data (published in February 2022 and May 2022), January 2020 was used as a reference point. But in this post, we use February 2020, which is in alignment with when the official National Bureau of Economic Research pre-recession peak occurred.
3 Blue Chip forecasters refer to private sector forecasters who participate in Wolters Kluwer’s Blue Chip Economic Indicators survey.


