

On September 23, 2025, we debuted the Chicago Fed Labor Market Indicators. Updated twice per month, this new data release provides an early read on U.S. labor market conditions: The Chicago Fed Real-Time Unemployment Rate Forecast is a forecast of the U.S. civilian unemployment rate while the Chicago Fed Layoffs and Other Separations Rate and the Chicago Fed Hiring Rate for Unemployed Workers provide further context for the job flows that influence the unemployment rate. In this article, we describe these new indicators and provide additional analysis for their first release for September 2025.
Tracking the labor market in real time
The Chicago Fed Labor Market Indicators provide both a timely and comprehensive view of labor market conditions underlying the U.S. Bureau of Labor Statistics (BLS) civilian unemployment rate. We combine monthly data from the Current Population Survey (CPS) with high-frequency labor market data and other more traditional survey measures to construct real-time estimates that summarize the flows of workers into employment (job finding) and out of employment (job separations). We then translate these estimated job flow rates into a forecast of the U.S. civilian unemployment rate (U-3 rate) reported by the BLS.
The following descriptions summarize the BLS civilian unemployment rate and our three new indicators.
- The civilian unemployment rate reported by the BLS in its Employment Situation report captures the number of people without a job who are searching for one as a share of the entire civilian labor market (people who are working or actively seeking work). This unemployment rate describes the labor market during a fixed reference week each month—the week that includes the 12th day of the month. The Chicago Fed Labor Market Indicators include a real-time forecast of this unemployment rate—the Chicago Fed Real-Time Unemployment Rate Forecast—for the reference week to be covered in the next BLS report. These new indicators also include a job separations rate of the employed—the Chicago Fed Layoffs and Other Separations Rate—and a job finding rate of the unemployed—the Chicago Fed Hiring Rate for Unemployed Workers.
- The job separations rate measures the prevalence of layoffs, discharges, and quits in the labor market at a given point in time in comparison with the number of employed persons. The Chicago Fed Layoffs and Other Separations Rate is an estimate of the percentage of previously employed workers that experienced such an event in the reference week of the month used by the BLS. As this rate increases, it puts upward pressure on the unemployment rate.
- The job finding rate measures the prevalence in the labor market of unemployed individuals successfully transitioning into employment at a given point in time. The Chicago Fed Hiring Rate for Unemployed Workers is an estimate of the percentage of previously unemployed workers that transitioned into employment during the BLS reference week. Job finding offsets the upward pressure on the unemployment rate coming from layoffs and other job separations. As such, an increase in this rate puts downward pressure on the unemployment rate.
Together, our three new indicators provide relevant context for both historical and future movements in the official U.S. civilian unemployment rate, as seen in figure 1. Observations in each panel of the figure to the right of the vertical dashed lines correspond to real-time estimates for the yet-to-be-reported BLS reference week, indicated by the blue marker (*), and are labeled in each panel along with the date of the end of the reference week in blue on the horizontal axis.
1. Chicago Fed Labor Market Indicators and the U.S. civilian unemployment rate
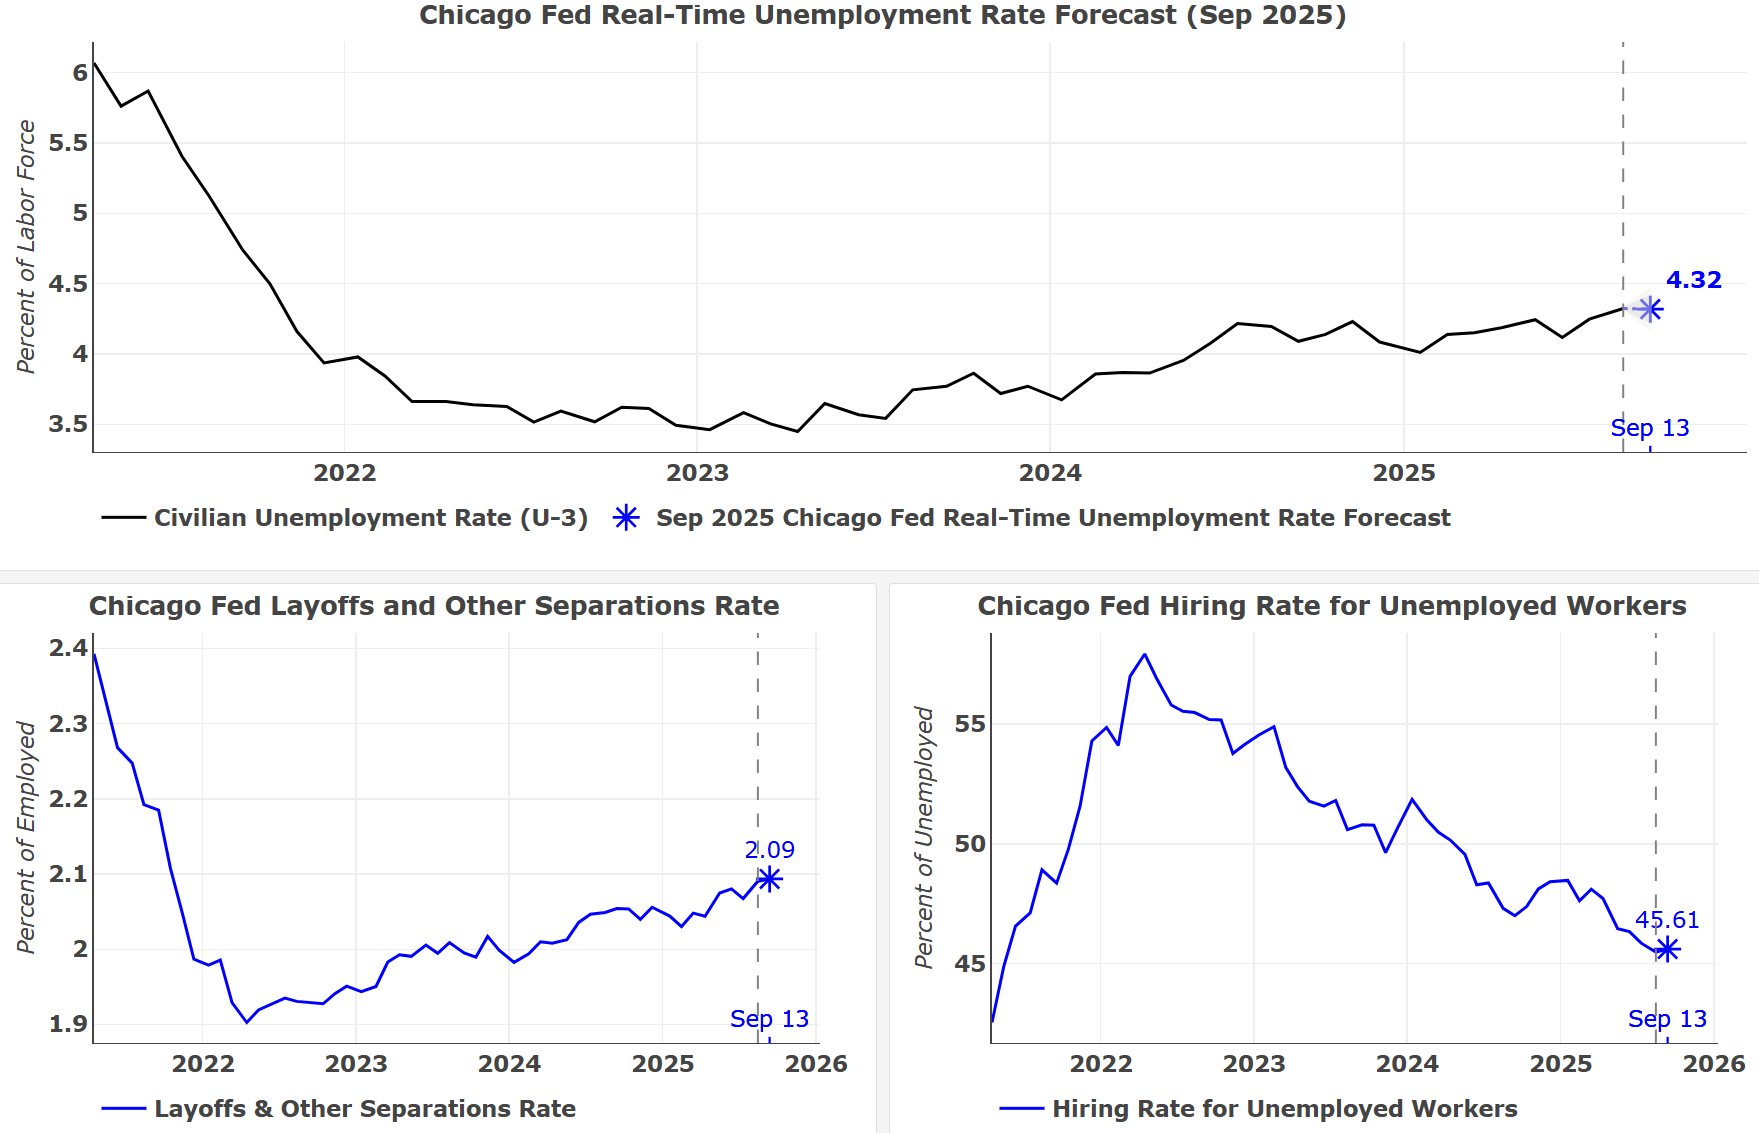
Sources: Chicago Fed staff calculations based on data from ADP, Bloomberg, The Conference Board, Google, Haver Analytics, Indeed, Lightcast, Morning Consult, and U.S. Bureau of Labor Statistics (BLS).
Through September 13, 2025, the Chicago Fed Labor Market Indicators suggest that U.S. labor market conditions are roughly steady since the last BLS Employment Situation report. Our estimates of both the job finding rate of the unemployed and the job separations rate of the employed have increased slightly. Jointly, these flows into and out of unemployment suggest stability in the rate of unemployment in September relative to August. Accordingly, the civilian unemployment rate is projected to be 4.3% (4.32% unrounded) in September, unchanged from 4.3% (4.32% unrounded) in August.
In the next section, we describe how we translate our estimates of job finding and job separations into a real-time forecast for the civilian unemployment rate and provide additional details for this forecast.
Translating job flows into an early read on unemployment
To translate our estimates of job finding and job separations into a forecast of the civilian unemployment rate, we first construct a summary measure of both that applies to the entire workforce. The flow-consistent unemployment rate is the ratio of the job separations rate () to the sum of the job finding () and job separations rates (). It summarizes the degree to which the netting of flows into and out of unemployment puts upward or downward pressure on the civilian unemployment rate.1
Our forecast of the civilian unemployment rate—the Chicago Fed Real-time Unemployment Rate Forecast—is then based on a statistical model that translates changes in the flow-consistent unemployment rate to an expected change in the civilian unemployment rate by drawing upon the close historical relationship between these two different measures of unemployment. Further details on this relationship and the statistical model that we use to capture it can be found in this June 2025 Chicago Fed Letter.
Figure 2 restates our forecast of the civilian unemployment rate for September 2025. In this instance, to summarize the inherent degree of uncertainty around this forecast stemming from our statistical model, we include both 50% and 68% prediction intervals (i.e., dark and light gray regions, respectively). These intervals are where one would expect the actual U-3 unemployment rate reported by the BLS to fall about 50% and 68% of the time, respectively.
2. Chicago Fed Real-Time Unemployment Rate Forecast for September 2025
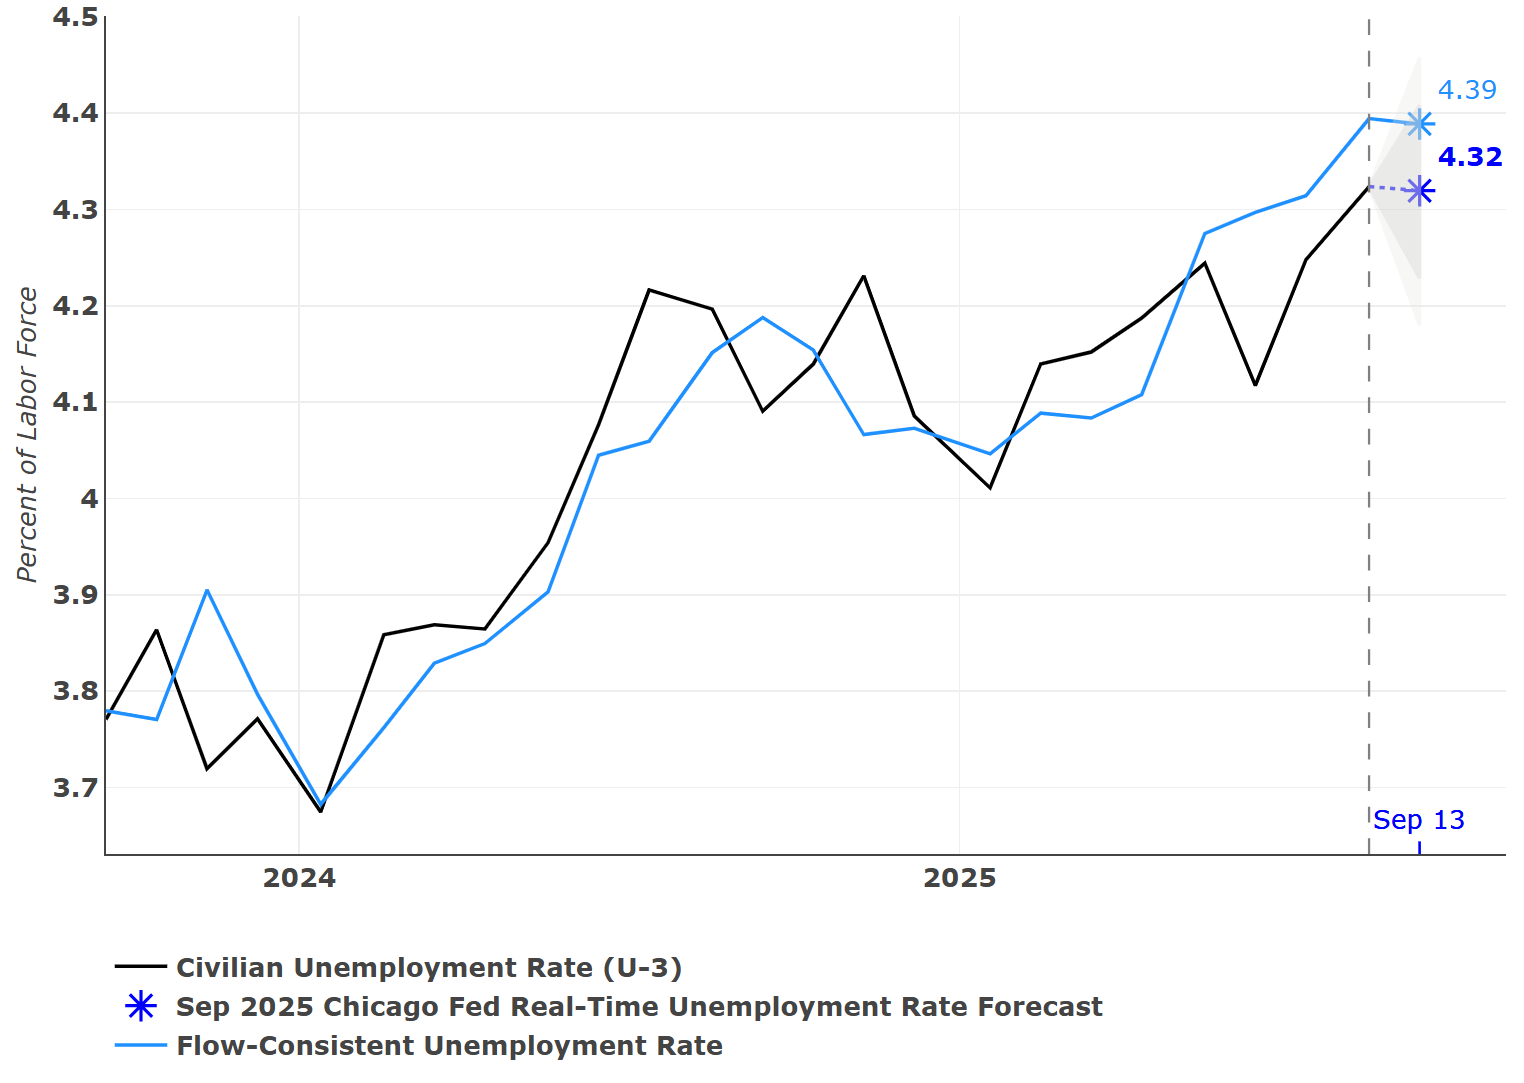
Sources: Chicago Fed staff calculations based on data from ADP, Bloomberg, The Conference Board, Google, Haver Analytics, Indeed, Lightcast, Morning Consult, and U.S. Bureau of Labor Statistics (BLS).
To provide additional context for the expected change in the civilian unemployment rate in September, we report in figure 3 estimated probabilities for a variety of potential outcomes for September and compare these estimates to historical monthly changes in the civilian unemployment rate. By construction, the change in the unemployment rate implied by our Chicago Fed Real-Time Unemployment Rate Forecast will always have the highest probability. One can then get a sense of the upside or downside risks to this forecast by examining how all the probabilities compare with each other.
3. September 2025 BLS unemployment rate change probabilities
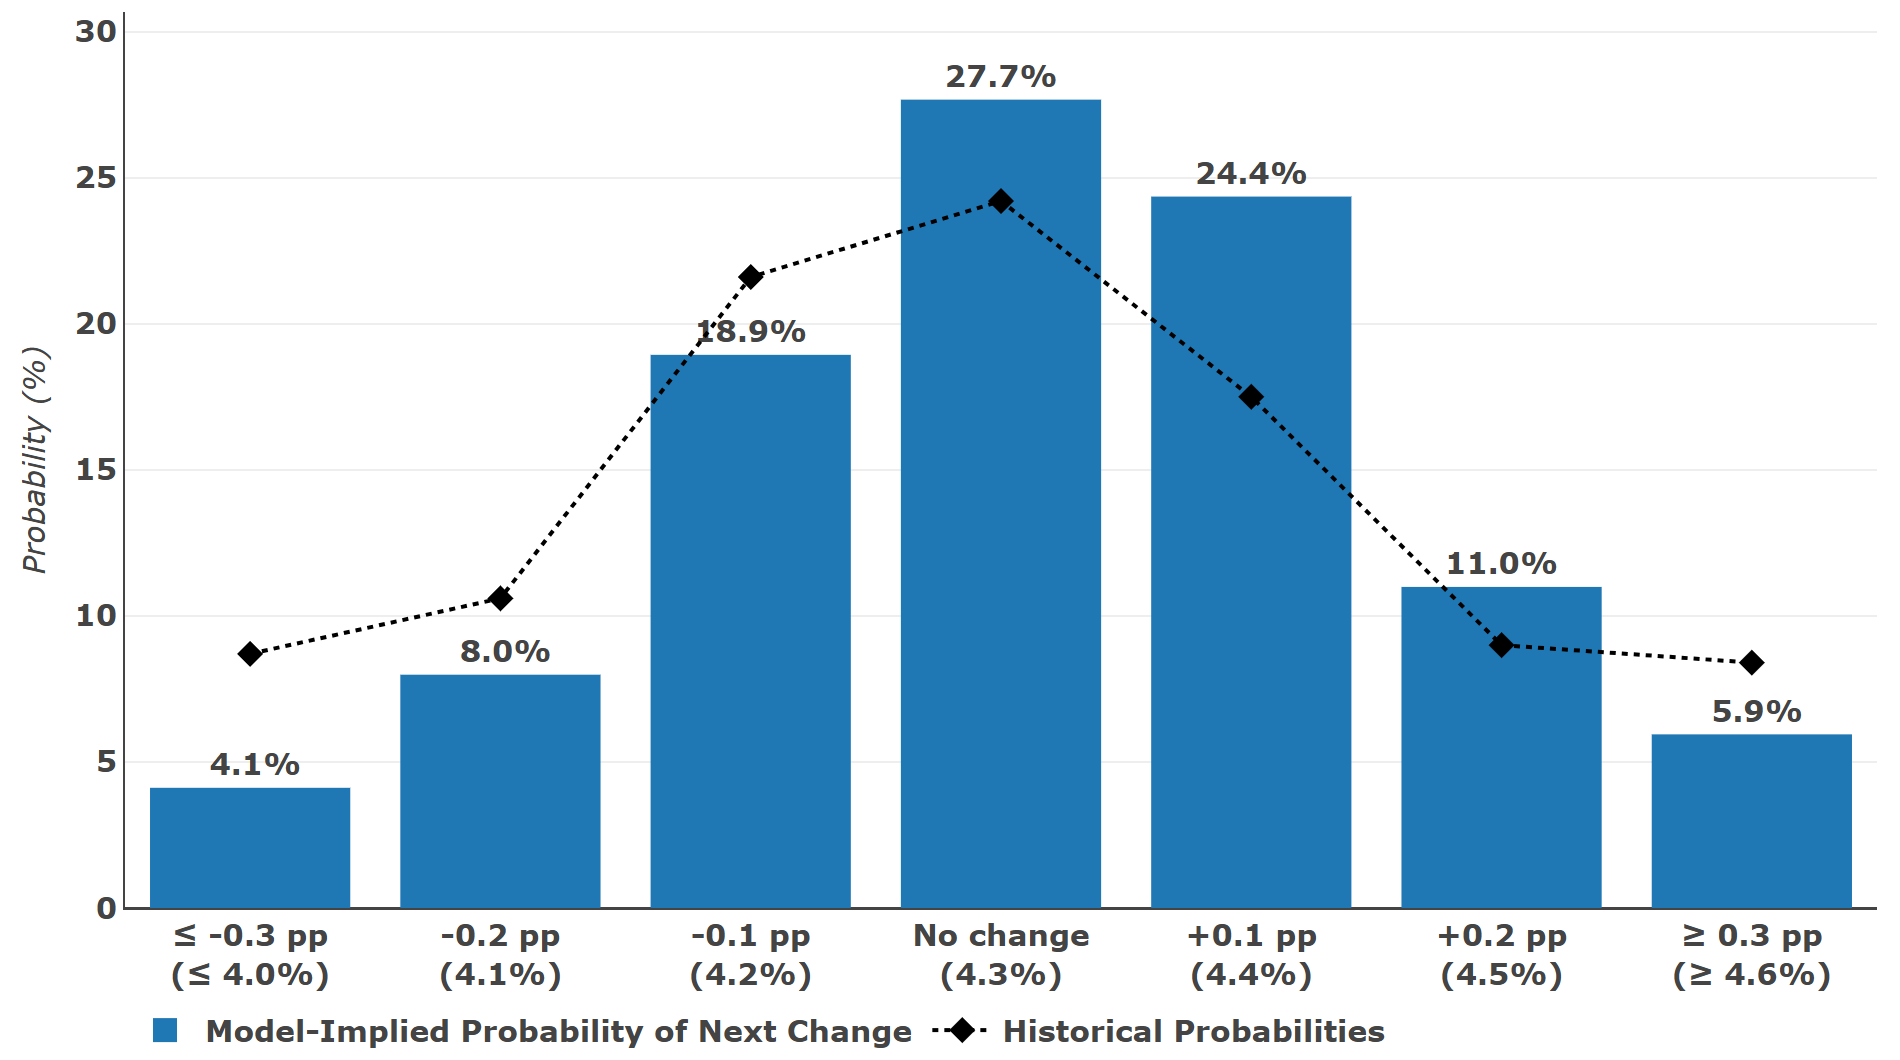
Sources: Chicago Fed staff calculations based on data from ADP, Bloomberg, The Conference Board, Google, Haver Analytics, Indeed, Lightcast, Morning Consult, and U.S. Bureau of Labor Statistics (BLS).
Our model’s implied probabilities suggest a slightly greater chance of a 0.1 percentage point increase than a 0.1 percentage point decrease in the civilian unemployment rate in September. The full distribution of probabilities for the change in the unemployment rate from August to September is shifted to the right (or higher values) compared with the corresponding historical probabilities based on sample averages since 1947. This skew suggests some potential upside risk to the statistical model’s forecast of 4.3% for September, with a 16.9% chance of an increase of 0.2 percentage points or more.
Where can I find the Chicago Fed Labor Market Indicators?
Further details on the Chicago Fed Labor Market Indicators, as well as the underlying data for all the figures we’ve discussed and an interactive dashboard including them, are available online. The next release of the Chicago Fed Labor Market Indicators is scheduled for October 2, 2025.
Note
1 We use the Shimer (2005) method to construct estimates for both the job finding and job separations rates from the CPS.
The CPS-derived job finding rate () is calculated as , where is the unemployment level and is the number of newly unemployed workers during the month.
The CPS-derived job separations rate () is calculated by setting the following mathematical expression equal to zero and solving for : , where is the unemployment rate.
These CPS-derived rates are combined with real-time labor market data using partial least squares to estimate the best fit for them. The best fit for the job separations rate is the Chicago Fed Layoffs and Other Separations Rate, and the best fit for the job finding rate is the Chicago Fed Hiring Rate for Unemployed Workers.


