

The following publication has been lightly reedited for spelling, grammar, and style to provide better searchability and an improved reading experience. No substantive changes impacting the data, analysis, or conclusions have been made. A PDF of the originally published version is available here.
The decade of the 1980s witnessed an explosive rise in economic development efforts at the state and local level. By the end of the decade, economic development, at one time or another, had been among the top three items on most state agendas. Municipalities, both large and small, took up economic development as a major public policy initiative.
Source of concern
There were a number of economic and political reasons that prompted state and local interest in economic development. One of the primary factors contributing to this interest was the back-to-back recessions of the early 1980s. Between December 1979 and November 1982, total nonagricultural payroll employment in the U.S. fell from 91.3 million to 89.4 million. The effects in the manufacturing sector were even more pronounced. During the same period, manufacturing employment in the U.S. fell from 20.9 million to 18.2 million.
These effects were felt more severely in the Seventh District where manufacturing represented a larger proportion of total employment relative to the nation. From December 1979 to November 1982, total nonagricultural employment in the Seventh District declined by 1.3 million workers, a drop of almost 10%. Over this period manufacturing employment in the District fell by some 877,000. Put another way, the District lost almost one-fourth of its manufacturing employment in a three-year period; and one-fifth of that loss was concentrated in the Chicago metropolitan area.
During the early 1980s, manufacturing employment became a less significant component of the national and District economies. In 1979, 28% of the District’s employment was derived from manufacturing. By the end of 1982, the share of manufacturing employment had fallen to about 24%.
These employment losses and structural changes were reflected in sluggish or declining population growth over much of the decade. For example, preliminary Census data indicate that the five District states’ population declined by about 160,000 between 1980 and 1990. Further, only two District states (Indiana and Wisconsin) gained population over the decade (see figure 1). While subject to dispute, these preliminary Census figures indicate a possible decline of 9.3% in the population of the city of Chicago and a loss of 19.4% in the city of Detroit between 1980 and 1990.
1. Seventh District states lose population to the South and West
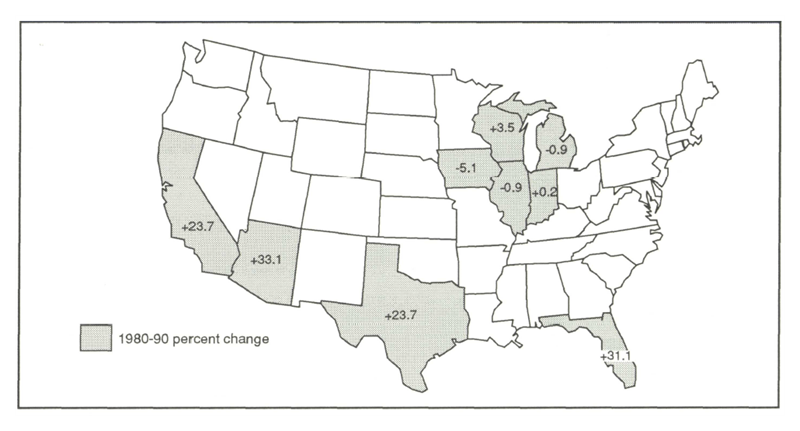
During the decade of the 1980s, people in the U.S. continued to move west and south and the Sun Belt states continued to expand. The total population of three states—California, Texas, and Florida—increased by over 11 million. Looked at another way, these three states had a population increase during the decade that was almost equal to the 1990 preliminary population estimate for all of the state of Illinois.
Economic shocks, structural changes, and demographic shifts presented significant public policy challenges for states and municipalities in the Seventh District. Many involved in economic development planning looked for ways to emulate the growth evolving in the Sun Belt states. Numerous strategic economic plans were devised to retain and attract new jobs and industries to the District. In many instances, the success of these efforts was measured by the local performance as compared to a perceived Sun Belt competitor.
However, basing Seventh District economic development policies upon economic changes in other regions of the U.S. may not be appropriate. Is it reasonable to expect a mature and structurally changing city, e.g., Chicago, to be able to achieve the 15% population growth experienced by Los Angeles during the 1980s? Given the fundamental differences between regions (such as climate) and the changes that have evolved (such as demographics), it is not clear that such comparisons will lead to appropriate policy prescriptions.
If the Sun Belt region is an inappropriate benchmark for comparison, then what alternative exists? The challenge becomes one of identifying economic areas that are somewhat similar in their economic and demographic factors. For the purposes of this Chicago Fed Letter, I have chosen to compare the metropolitan economies of Chicago and Toronto.
A comparison of “Second Cities”
Chicago and Toronto are similar in several aspects. Both are viewed as important “second cities” within their respective nations in North America. Chicago is the larger of the two metropolitan areas with a 1988 population of 7.4 million. Toronto’s population was 3.5 million.1
The offset to Chicago’s larger absolute size is the fact that Toronto is Canada’s largest metropolitan area with 14% of Canada’s population. Chicago is now the third largest metropolitan area in the U.S. with about 4% of the total population.
Both metropolitan areas have extensive industrial bases (see figure 2). In 1989 manufacturing employment represented about 18% of Chicago’s employment and 23% of Toronto’s. Chicago’s manufacturing employment share approximately equals that of the U.S. while Toronto’s is about 5 percentage points higher than the Canadian average. Both metropolitan areas have manufacturing concentrations in printing and publishing, chemicals, fabricated metals, nonelectrical machinery, and electric and electronic equipment.
2. Similar employment patterns on both sides of the border
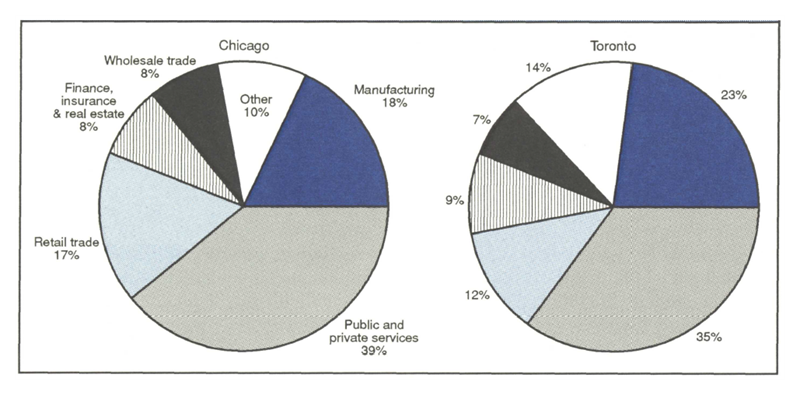
Chicago has a larger share of its employment in the public and private service sector (39% for Chicago versus 35% for Toronto).2 Both metropolitan areas have attracted a large number of each nation’s corporate headquarters for industrial activity. As of 1988, 198 of Canada’s 500 largest industrials had head office operations in Toronto, while Chicago had only 42 of the U.S.’s 500 largest industrial head offices.
Both metropolitan areas have undertaken efforts to build upon their banking and other financial service industries. Interestingly, in 1989 both metropolitan areas had very similar shares of employment (8% in Chicago and 9% in Toronto) centered in finance, insurance, and real estate. Both metropolitan areas also have about equal shares of employment in the combined manufacturing and public/private service sectors.
One observation emerges from these facts. While Chicago has struggled to decide whether it wants to become either an industrial center or a service center, the balance appears to weigh in favor of services. On the other hand, Toronto’s strategy has been to focus on becoming the desired location for head offices of European and Asian firms. Thus, what is of further interest are the paths followed by the two metropolitan areas to get to where they are today and where they may go in the future.
Differing patterns of growth
Comparing employment growth from the first quarter of 1983 through the fourth quarter of 1989 reveals some interesting insights into the performance and evolution of these metropolitan economies. (This period represents the seven years of sustained economic growth in the U.S.)
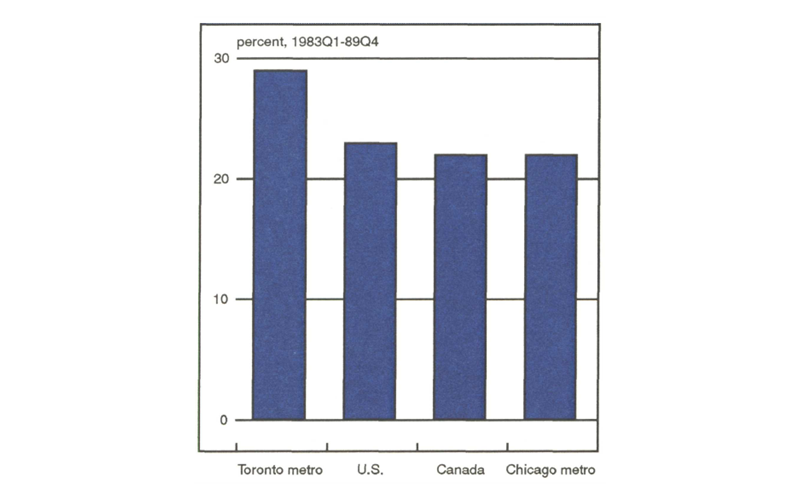
First, the data reveal that Toronto’s total employment growth over this period was about 7 percentage points greater than Chicago’s (see figure 3). Toronto’s employment was up by 29% compared to Chicago’s growth of 22%. Toronto’s total employment growth exceeded that of both Canada (up 22%) and the U.S. (up 23%).
3. Employment growth trends
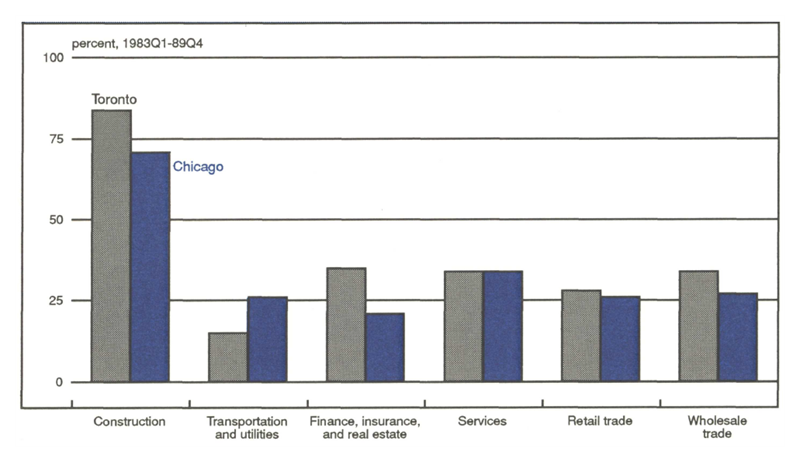
Comparing the two areas’ high-growth sectors reveals that Toronto tended to exceed Chicago’s growth in most sectors (see figure 4). Toronto’s employment growth was greater in construction; finance, insurance, and real estate; retail trade; and wholesale trade. Chicago’s performance exceeded that of Toronto in transportation and utilities. Interestingly, both areas had identical growth in their service sectors (26%).
4. Sectors of high growth
Differing approaches to change
Many of the forces of change lie beyond the scope of local control. Demographic shifts and globalization of the world economy are factors that affect most regions that they have no means of modifying.
At the local level, however, planning and development efforts can modify the outcome of events that are under local control. It is in this area that the two metropolitan areas have taken different approaches.
In the early 1950s, Toronto enacted a federal form of government that consolidated 13 independent municipalities into six. These six governmental bodies are responsible for local affairs, while a metropolitan council administers certain regional services, such as trash collection and transportation, and planning. This metropolitan council also provides a means by which the city of Toronto can borrow against its financial resources to support the growing suburbs.
The metropolitan council finances education for the area. The system of public and private schools receives funding from a metropolitan-wide property tax. It is felt that this metropolitan support for education has been responsible for retaining middle class residents in Toronto.
Toronto, like many American cities, has suffered from urban sprawl. To limit such growth, Toronto planners have resisted efforts to expand the highway system through the city. Such limitations are considered essential to avoid neighborhood deterioration and keep riders on the public transportation system.
The approach to economic development and planning problems in the Chicago metropolitan area has been more fragmented. This arises, in part, from the fragmented structure of government in the state of Illinois. The state, as of 1987, had a total of 6,627 governmental bodies. Of these governmental units, 1,299 (20%) were located in the eight-county Chicago metropolitan area. Many of these units contribute directly or indirectly to development-related efforts.
These multiple jurisdictions make the coordination of development and planning more difficult. The shift of jobs and businesses to suburban areas has raised the costs and stymied development planning in critical areas such as transportation and education.
It is important that state and local areas identify appropriate areas for comparison. This article has suggested that in the past many jurisdictions in the Seventh District may have tracked an inappropriate target—the South and the West. Comparing Chicago and Toronto’s paths of development and change might lead to more insightful and valuable policy conclusions.
MMI—Midwest Manufacturing Index
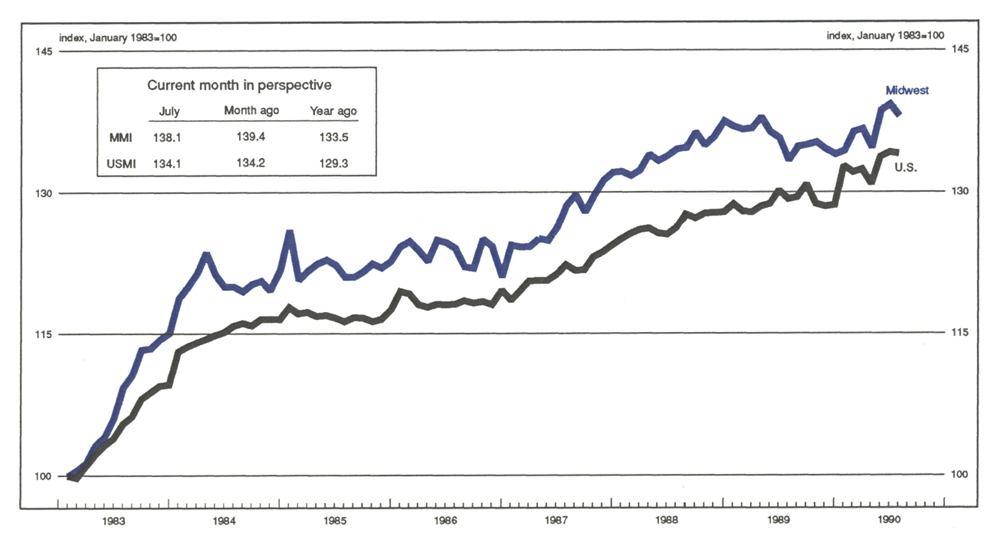
After advancing for two straight months, manufacturing activity in the Midwest dropped 0.9% in July, mostly from employment cutbacks. Modest employment losses were recorded in about half of the industries, but electrical equipment was the only industry with a sharp decline. Manufacturing employment between May and July remained at its highest level since September 1989.
The decline in Midwest manufacturing was deeper than the 0.1% national decline in July, with all major sectors in the Midwest weaker. The Midwest rebounded from its lowest point of the year in April at about the same pace as the nation (up 2.5%), with the transportation sector playing a key role.
Notes
1 The Chicago metropolitan area is defined as Cook, DuPage, Grundy, Kane, Kendall, Lake, McHenry, and Will Counties. The Toronto metropolitan area refers to the Toronto Census Metropolitan Area, which includes the city of Toronto and 29 surrounding municipalities.
2 Some differences in sector employment may arise due to differing methods employed in the two countries’ methods of data collection.


