

The following publication has been lightly reedited for spelling, grammar, and style to provide better searchability and an improved reading experience. No substantive changes impacting the data, analysis, or conclusions have been made. A PDF of the originally published version is available here.
The U.S. economy underwent a debt explosion in the 1980s. Widespread denunciations of the leveraging of America have become grist for both serious commentary and political worry-mongering about the future of the U.S. economy. However, recent weakness in money and credit growth combined with the continuing lackluster performance of the U.S. economy have softened the general distrust of debt growth and generated significant pressures to ease monetary policy until the rate of money and credit growth returns to historically normal rates. What is not well understood in this debate is the degree to which the changes in the make-up of U.S. credit flows that began in the 1980s has obscured the reality of the situation. Innovative financing techniques and tax-related intermediation, in combination with the continuing fallout of the thrift bailout, have combined to conceal the meaningful movements in credit flows beneath a tidal wave of substantially larger, but less meaningful financial trends.
The credit crunch, as it is called, is the outgrowth of changes in private sector loan evaluation standards and in regulatory practices that occurred in the late 1980s. Tighter capital requirements, higher deposit insurance premiums and a substantial increase in market discipline have all made it harder for some types of borrowers to qualify for credit, both in regulated and nonregulated markets. Such pressures have been cited regularly by Chairman Greenspan and other senior policy officials as part of the justification for a number of interest rate reductions in the last two years. Today, even with short-term interest rates at 13-year lows, credit growth remains anemic, raising the question of whether interest rates should be lowered until money and credit respond.
The seriousness of the situation posed by the ongoing credit crunch is clear; however, before too much weight is placed on forcing money and credit growth to historically “normal” rates, it is important to understand just how distorted these numbers have become. The economy’s need for credit is unquestioned, but those credit flows need to reflect the reality of today’s financial and economic environment, not historical averages.
Distortions run amok
Probably the most discussed development in the credit markets in the 1980s was the massive buildup of debt by American corporations. Between 1984 and 1990, U.S. corporations added $1.1 trillion of debt to their balance sheets. This helped generate an explosion not only in corporate debt, but also in total nonfinancial debt and total debt for the U.S. as a whole. During this same period, corporations were buying their own stock back at a rate of $90 billion a year. As can be seen in figure la, these two phenomena were actually mirror images of each other.
1. The corporate picture
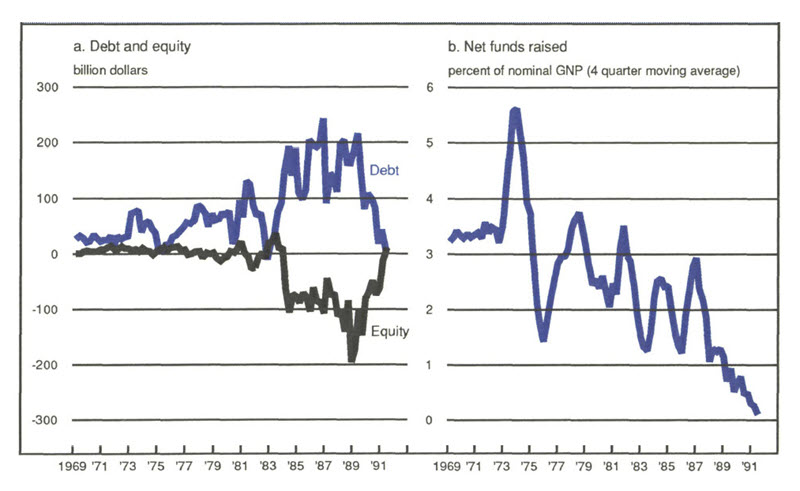
Essentially, corporations were just crossing the word “stock” off their stock certificates and penciling in the word “debt.” Very little growth-related economic activity was involved in this process, just a lot of very expensive financial transactions. Nevertheless, it caused debt aggregates to soar relative to economic growth and destroyed what up until then had been a solid statistical relationship between nonfinancial debt and real growth. Today, the situation has normalized to some extent. Debt growth is down and equity growth is actually positive again. The reversal is causing debt aggregates to seem depressed relative to the go-go 1980s and, to some extent, even to the more normal periods in the 1960s and 1970s, as the excesses of the 1980s are unwound.
The economic reality underneath all the balance sheet gymnastics is startling, especially given all the hype about increased importance of the financial markets in the 1980s. Figure 1b shows total net funds raised by nonfinancial corporations from all sources as a share of nominal GNP (stock buybacks are netted out of the increase in debt instruments). This shows that, relative to overall economic growth, external funding of corporations has actually been of declining importance in the U.S. since the mid-1970s. This process may have accelerated somewhat beginning in 1986 but has not shifted appreciably since then. Thus, while corporate debt growth has been declining, it has done so along a six-year trend.
There are a number of likely reasons for this trend. First, as corporations have become larger and more diversified, they are better able to finance investment out of current cash flow. Second, the high speed, highly imitative nature of modern international business practice favors large firms purchasing or licensing new technologies for rapid development over innovators acquiring external funding to build their own firms. Third, U.S. tax policy has consistently favored internal funding over debt and debt over equity, giving high cash flow firms that can invest their own cash flows a major competitive advantage, reinforcing the trend away from external finance and toward internal funding. The trend toward internal corporate funding is unmistakable and implies that corporate debt growth will in all likelihood either continue to decline or, at least, not grow as fast as historical averages would indicate. In fact, if U.S. corporations are going to reverse the leveraging of the 1980s, current downward trends may continue for some time, regardless of the growth level in the economy.
The path of government borrowing over this period provides another, no less cautionary, tale about the easy interpretation of credit numbers. The large run-up in government borrowing in the late 1970s and early 1980s shown in figure 2 and the resulting increase in total borrowing in U.S. credit markets is well known. The recent trends and their implications are less well understood. Government borrowing began to fall as a percent of GNP beginning in 1986 and by 1989 had fallen to 3% of nominal GNP. While still sizable, this level of government borrowing was not large by international standards, putting less strain on the markets as well as damping the rate of overall credit growth relative to economic growth.
2. U.S. government borrowing
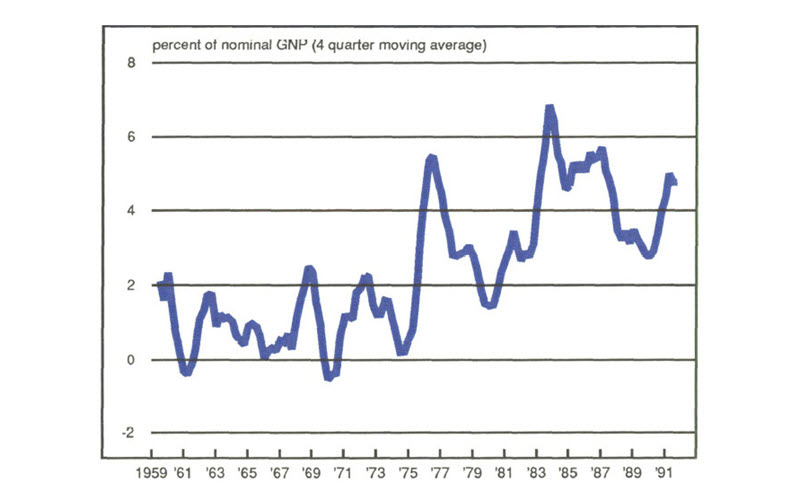
More recently, in large part due to the need to finance the thrift industry bailout, government borrowing has again exploded. This run-up, however, is very different from the earlier one. In this case, the government is assuming debts already in the economy. Very little in the way of resource allocation, the real meat and potatoes of economic growth, is actually happening. All that is really going on is that a large number of S&L liabilities are becoming (officially) liabilities of the U.S. government, damping financial debt growth and swelling nonfinancial debt. While this has significant consequences for taxpayers, it does not put any additional stress on the credit markets. Before the bailout, the S&Ls owed the money, now the government does. No new funds other than working capital for the Resolution Trust Corporation are actually required. In fact, as the government is not making the types of questionable loans that got many of the now defunct S&Ls in trouble, more funds rather than less may well be available for productive investment. Thus, nonfinancial debt growth has been pushed up relative to economic growth while financial aggregates and the savings component of the money supply are depressed. As before, much of what we observe in the credit numbers is not related to economic activity, but to large-scale changes in labeling of assets.
It’s not all bookkeeping
Not all of the large movement in the credit aggregates are labeling changes. The 1981 and 1982 tax bills, building on previous tax laws, heavily favored certain types of offsetting financial transactions. Under these tax laws, it often paid to borrow money on which the interest was deductible and invest in some other, often complicated, financial shelter arrangement that paid tax-free returns or produced tax write-offs. This often generated a host of offsetting financial transactions for one (and sometimes no) economic investment. The simplest examples are individuals who borrowed cash from banks to invest in IRAs in order to take advantage of the IRA tax deduction and the deductibility of interest on the bank loan. Some of the fastest growth in tax-generated intermediation was in complicated Subchapter S corporations and limited partnerships arrangements that often, though not always, involved complicated real estate deals and leasebacks that could generate large numbers of offsetting financial transactions.
These tax laws generated a massive increase in purely financial credit activity that had little, if anything, to do with economic activity. This can be seen in figure 3a, which shows as a percent of GNP the net funds flows into the nonfarm, noncorporate sector, which includes all the Subchapter S corporations and other tax shelter activity. Figure 3b shows the growth in commercial real estate mortgages, a particularly favored recipient of special tax treatments, and figure 3c shows nonmortgage consumer debt, which includes all of the individual efforts to take advantage of the tax laws. As can be seen, intermediation activity exploded in all of these sectors from 1981 to 1986, reaching historical highs. At their peak, the funding going into these sectors was immense. The nonfarm, noncorporate sector absorbed $129 billion in 1985. Commercial mortgages peaked at $74 billion in 1986. Consumer nonmortgage debt peaked at $83 billion in 1985, for a total in the three sectors of $286 billion.
3. The tax effect
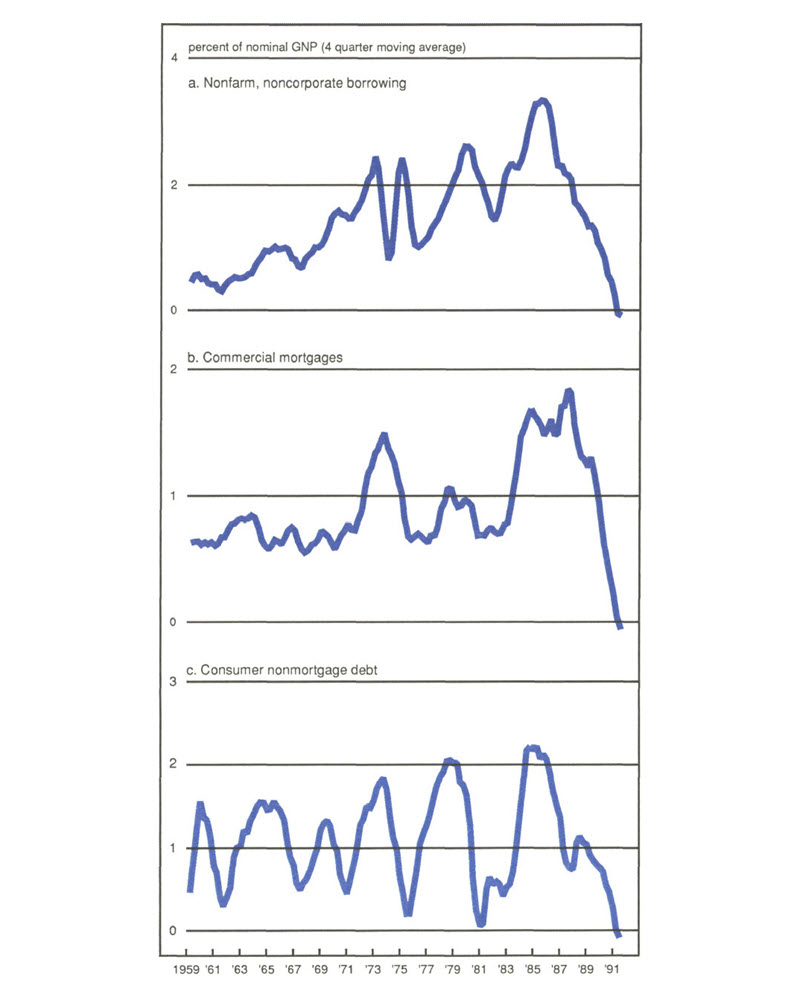
The Tax Reform Act of 1986 removed many of the incentives for purely financial transactions. Tax shelters were in large part eliminated. The special treatment of commercial real estate was severely reduced, and many of the individual incentives, such as the interest deductibility of nonmortgage consumer debt, were eliminated or phased out. The effect was enormous. By 1990, the flows into nonfarm, noncorporate credit, commercial mortgages, and consumer nonmortgage debt had dropped to $14 billion, $9 billion, and $14 billion a year, respectively, all historical lows. This means that these sectors are absorbing $249 billion a year less in credit than they did in 1985. Further, as can be seen in figures 3a, 3b, and 3c, these changes did not occur overnight but rather constitute a continuing restructuring of credit flows. These shifts in basic trends clearly make detecting recent movements in credit creation virtually impossible.
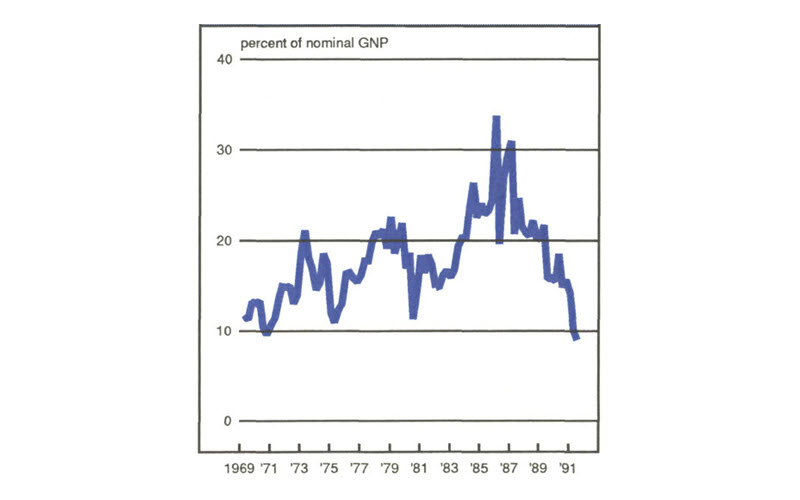
One way to see this in terms of the overall market is shown in figure 4, which shows net credit raised in all sectors, thus illustrating the full force of the explosion in purely financial transactions. The rapid rise from the 1981 tax bill and the equally dramatic reversal of trend that begins with the 1986 tax bill stand out in sharp relief. Credit flows peak in the fourth quarter of 1985 at an unbelievable 34% of GNP or $1.387 trillion and then descend steadily to a current level of 9% of GNP or $505 billion. It is equally apparent from this graph that detecting whether or not there has, in fact, been a decline in credit creation due to the credit crunch is much like trying to measure the effects of an electric fan in the midst of a hurricane.
4. Total net credit raised
Nor does it help, as some have suggested, to concentrate on the banking sector as a provider of business loans to measure the potential effects of the credit crunch. As figure 5 shows, bank loans not elsewhere classified (where the bulk of business lending done by banks is counted) has been declining steadily as a percent of GNP since the 1970s. While the recent drop may be a bit faster, it is no more dramatic than other declines over this period, only some of which were in any way associated with economic slowdowns. This conclusion is further reinforced by the observation that banks were also engaged in the tax-generated lending of the early 1980s as well as the subsequent decline. Consequently, bank loan numbers are subject to all of the same problems of interpretation as the numbers presented above. The fact is that, as worrisome as recent trends in money and credit growth have been in light of sluggish overall economic performance, they are, in terms of the credit numbers, at most a modest backwash in the midst of the ferocious riptides of financial restructuring.
5. Bank loans n.e.c.

Conclusion
This article has examined recent trends in credit creation and suggested that these trends are in large part the results of major patterns in the U.S. economy as well as the unwinding of the effects of the tax policies of the 1980s. These trends are so large that any evaluation of current credit numbers to determine the direction of current policy are subject to substantial uncertainty and should be treated as such. When there are major changes in financial structure, as so often been the case in the 1970s and 1980s, policymakers must rely heavily on real economic numbers and exercise careful judgment concerning what constitutes reasonable economic performance. In such an environment, policymakers cannot rely on simple rules, or on limited sets of financial indicators. Given recent economic performance and known changes in the financial environment, concerns about the availability of credit are in all likelihood well-founded. Nevertheless, as this article has argued, we should examine the overall performance of the economy and the terms of credit availability rather than the credit flows for information to guide the future course of policy.


