

The following publication has been lightly reedited for spelling, grammar, and style to provide better searchability and an improved reading experience. No substantive changes impacting the data, analysis, or conclusions have been made. A PDF of the originally published version is available here.
Economists often call for an increase in public spending in order to spur economic growth. For example, despite the yawning federal budget deficit, 100 economists, including six Nobel laureates, recently proposed that federal spending on education and infrastructure be increased in order to stimulate growth in the economy. Proposals such as this one favor investment-oriented government spending over consumption-oriented spending. While both types of spending—consumption or investment—may be helpful in boosting short-run aggregate spending during an economic downturn, investment spending carries the added benefit of stimulating longer-term welfare, growth, and international competitiveness. Programs such as public aid, prisons, and government administration tend to have benefits that are immediately consumed. Other expenditures such as education and infrastructure development are investment oriented, producing returns to society years after the initial expenditure.
Traditionally, the use of spending as an agent of economic growth has been primarily a concern of the federal government. However, during the 1980s, many program responsibilities fell upon state and local governments as federal support was withdrawn. Left to fend for themselves, state and local governments have shown more interest in using fiscal policy to help their economies grow. The question is: Have state and local governments been adopting investment-oriented spending strategies by boosting expenditures on education, infrastructure and the like? In this Chicago Fed Letter, I look at the implications of the choice of consumption versus investment strategies by state and local governments, both nationally and within the five Seventh District states of Illinois, Indiana, Iowa, Michigan, and Wisconsin.
The evidence
In order to examine the mix of state and local expenditures, it is first necessary to divide the various categories of expenditures into investment and consumption components. Statistics covering government spending are not typically reported as consumption or investment so the data must be reassigned. This assignment is far from an exact science since most if not all programs have elements of both consumption and investment.1 In this article, state and local government spending that is investment oriented will include all capital outlays (spending on buildings, roads, equipment, school buildings, and other infrastructure) as well as all noncapital education and noncapital health and hospital spending. (For the purposes of this article, health and hospital expenditures will not include Medicaid expenditures. When Medicaid is included, health related expenditures grow at a faster rate.)
Spending on infrastructure is perhaps the most obvious investment by government. A bridge or building will provide a benefit to future taxpayers who will utilize and benefit from the physical structure years after it is completed. However, spending designed to enhance human rather than physical capital is increasingly being considered investment spending. Many publicly funded programs within the areas of education and health care fit such a definition. Spending on education provides a future return to society in the form of more productive workers as well as citizens who are better able to participate in the democratic decision-making process. Spending on health reduces the threat of contagious disease and improves worker productivity since healthy workers are likely to be more productive workers. Of course, future returns need not appear as part of the economic statistics in order to qualify as returns to investment. For example, greater longevity or a greater sense of physical well-being are no less important as returns to public investment.
In using these three types of spending as a proxy for government investment in physical and human capital, the remainder of government expenditures (spending on corrections, public welfare, and government administration) are considered consumption-oriented spending. Figure 1 illustrates the estimated trend in investment versus consumption spending for all state and local governments and for the five Seventh District states by indexing the per capita relative real growth rates in the four expenditure types since 1968. As the figure shows, consumption expenditures have grown much faster than investment expenditures over this 21-year period. The growth in consumption expenditures over this period was over 140% while the growth in the three investment-oriented spending categories ranged from 52% for health and 27% for education to an 11% decline in capital outlays. (If Medicaid spending is included in health expenditures, the growth rate is slightly over 80% for the category.)
1. Index real per capita growth rates for state and local expenditures
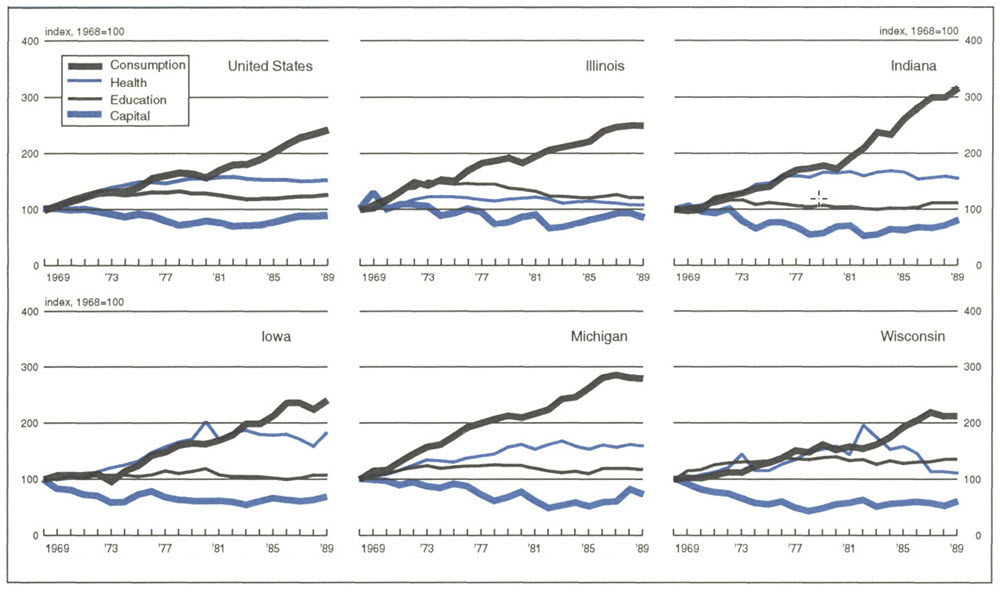
Figure 1 also demonstrates the pattern of consumption versus investment expenditure growth for the Seventh District states. While their experiences differ, the growth in consumption expenditures outpaced the growth rate in the three investment spending categories in all five states. Within the investment area, Indiana, Iowa, and Michigan all mirrored the national trend with noncapital health and hospital spending growing the fastest, followed by noncapital education and capital outlays. Illinois and Wisconsin differed in that education spending was the fastest growing investment component, followed by health and capital outlays.
Why has the mix of investment and consumption changed?
Numerous studies have pointed out the benefits and economic returns on various types of investment goods provided by state and local governments. These studies range from those that have found a significant relationship between state infrastructure spending and productivity growth to studies focusing on education spending and its positive relationship to employment and industrial growth.2 One recent study even found that the negative effect of higher business taxes can be overcome when the revenue raised is used to fund spending on education, highways, public health, and safety.3 Owing to the apparent consensus on the benefits of these investments, it is difficult to understand the lag in investment-oriented spending by the state and local sector during the 1980s.
Several explanations may be helpful. First, dwindling state and local resources would seem to explain part of the story. The flattening of the growth rates in the three investment-oriented categories and the growth in the consumption-oriented spending coincides with the reduction in federal grants to the states during the 1980s. Federal aid to the states reached its zenith in 1978. Since then, declining levels of support have forced states to fund programs out of their own resources. During this era of increasing responsibilities and dwindling resources, investment spending gave way.
More recently, strained state and local budgets have exacerbated the problem. Just as a household with a tight budget will put off investments in favor of putting food on the table, state and local governments are emphasizing keeping up with current operating expenses rather than spending on investments. The most recent National Income and Product Account data illustrates this. In the recessionary year of 1991, spending on consumption-oriented transfer payments grew by 14% while expenditures for the investment-oriented purchase of structures fell by 1.3%.
A second explanation concerns the effect of political behavior on spending patterns. Given the limited term of office of many policymakers and barring the very close interest and scrutiny of an informed public, those policies that produce immediate and visible results are likely to be favored over long-term investments that may not demonstrate results for many years. For example, the bulk of the return from increased investment in elementary and secondary education will not be realized until the individual receiving the education is an adult. As such, the political benefit to the policymaker is less than in the case of a program that provides an immediate and visible benefit to constituents (such as building a park). Similarly, the perceived returns from educating a younger generation may seem distant to portions of the voting population or even be perceived as risky due to outmigration of the young from declining regions.
Third, it may be the case that current forms of government accounting and reporting fail to accurately portray the distinction between consumption and investment. If so, policymakers may be unaware of the shift toward consumption spending within their states. For this reason, it may be wise for state and local governments to devise investment budgets, in which the programs within these categories can be classified as investments or consumption. For example, a report was issued by the Michigan House Fiscal Agency urging the development of an investment budget.4 In Wisconsin, a controversial new welfare proposal attempts to recognize explicitly the investment-oriented aspects of the state’s welfare program by rewarding education, training, and employment of welfare recipients.
Finally, the demand for these four types of spending has also changed over this period of time. For example, in the area of infrastructure spending, Seventh District states, which can be characterized as having a more mature economic base, developed much of their infrastructure earlier than other regions of the country. While pressure for maintaining the existing infrastructure exists, the demand for new infrastructure is less intense than in rapidly growing regions. This may explain why capital outlays in the five District states declined faster than was the case for the nation as a whole. In the case of the U.S., the decline in school enrollments in the 1980s lessened the demand for rapid growth in school budgets, helping to explain the initial decline in the growth rate in school expenditures in the 1980s. By the end of the decade, the growth rate was beginning to rise, reflecting the growth in school enrollments expected to continue through the mid-1990s.
Implications
State and local governments are charged with a broad range of functions. Clearly, no state or local government should ignore the immediate needs of its constituents in order to increase investment. However, the work of several economists has focused on whether the slowdown in public capital outlays has hindered economic and productivity growth.5 If estimates of returns from physical capital investment are correct, the fact that state and local governments are devoting a smaller share of their available resources to these expenditure areas may indicate a less productive use of state and local resources. If a similar return can be established for programs geared to human capital investments, policymakers may be missing an opportunity to expand their economies by not taking a more aggressive position in supporting investment-oriented expenditures.
With a need to rebuild crumbling infrastructure and provide education to a growing school aged population, the demand for these investment-oriented expenditures is likely to grow. However, increasing investments in other, less tangible, programs, such as maintaining the local sewer system or targeted education and health programs, may be more difficult to justify unless a clearer distinction between consumption and investment spending is made in government accounts. As the proposal from the 100 economists favoring increased federal spending pointed out, wise investments in education and infrastructure are a very different avenue from merely increasing the level of government expenditure or running an operating deficit.
Tracking Midwest manufacturing activity
Manufacturing output index
| April | Month ago | Year ago | |
|---|---|---|---|
| MMI | 138.3 | 138.2 | 134.2 |
| USMI | 133.2 | 133.5 | 131.1 |
Motor vehicle production (millions, saar)
| May | Month ago | Year ago | |
|---|---|---|---|
| Autos | 6.2 | 5.9 | 5.3 |
| Light trucks | 3.7 | 3.8 | 3.4 |
Purchasing manager’s association: production index
| May | Month ago | Year ago | |
|---|---|---|---|
| MW | 60.3 | 57.7 | 48.1 |
| U.S. | 63.0 | 56.9 | 48.1 |
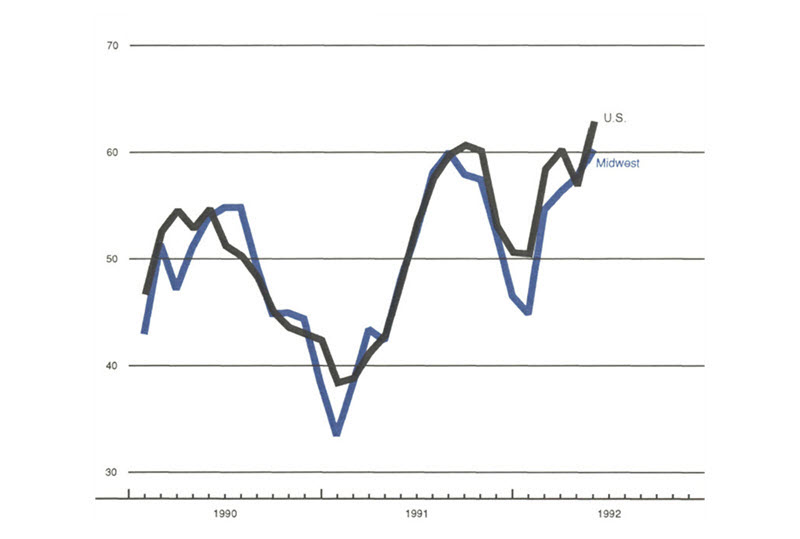
Purchasing Managers’ Survey—production index
Sources: The Midwest Manufacturing Index (MMI) is a composite index of 17 industries based on month hours worked and kilowatt hours. IP represents the FRBB industrial production index for the U.S. manufacturing sector. Autos and light trucks are measured in annualized physical units, using seasonal adjustments developed by the Federal Reserve Board. The PMA survey for the U.S. is the production components of the NPMA survey and for the Midwest is a weighted average of the production components of the Chicago, Detroit, and Milwaukee PMA survey.
Manufacturing activity in the Midwest, as measured by a weighted average of the production indexes of the Chicago, Detroit, and Milwaukee Purchasing Managers’ Surveys, expanded in May for the fourth consecutive month. The composite index equaled its previous peak in August of 1991. (An index level of 60 indicates that 60% of the responses reported expanding production and 40% reported contraction.)
The Midwest has generally followed the national pattern but showed a deeper contraction in the fall of last year and slightly slower expansion than the nation since January, largely because of weakness in the Detroit economy. Chicago and Milwaukee showed expansion equal to or stronger than the nation as a whole.
Notes
1 For example, in this analysis, public welfare payments are assumed to be consumption spending. However, in some states, training programs are included in public welfare programs and these would certainly represent investments.
2 See T.R. Plaut and J.E. Pluta, “Business climate, taxes and expenditures and state industrial growth in the U.S.,” Southern Economic Journal, Volume 50, No. l, 1983, pp. 99-ll9, and Michael Wasylenko and Therese McGuire, “Jobs and taxes: the effect of business climate on states’ employment growth rates,” National Tax Journal, Volume 38, 1985, pp. 497-51l.
3 Jay Helms, “The effect of state and local taxes on economic growth: a time series cross-section approach,” The Review of Economics and Statistics, Volume 67, 1985, pp. 574-582.
4 See Warren Gregory, Investment Budgeting: Moving Back to Michigan’s Future, Michigan House Fiscal Agency, August 1991.
5 For more on the return to public infrastructure investment see David Alan Aschauer, “Government spending and the ‘falling rate of profit,’” Economic Perspectives, Federal Reserve Bank of Chicago, May/June 1988, pp. 11-17; also Aschauer, “Is public expenditure productive?,” Journal of Monetary Economics, Volume 23, 1989, pp. 177-200; and Alicia Munnell, “How does public infrastructure affect regional economic performance?,” Is There a Shortfall in Public Capital Investment? Federal Reserve Bank of Boston, Conference Series No. 34, 1990.


